Rogers 2011 Annual Report Download - page 39
Download and view the complete annual report
Please find page 39 of the 2011 Rogers annual report below. You can navigate through the pages in the report by either clicking on the pages listed below, or by using the keyword search tool below to find specific information within the annual report.-
 1
1 -
2
-
3
-
4
-
5
-
6
-
7
-
8
-
9
-
10
-
11
-
12
-
13
-
14
-
15
-
16
-
17
-
18
-
19
-
20
-
21
-
22
-
23
-
24
-
25
-
26
-
27
-
28
-
 29
29 -
 30
30 -
 31
31 -
 32
32 -
 33
33 -
 34
34 -
 35
35 -
 36
36 -
 37
37 -
 38
38 -
 39
39 -
 40
40 -
 41
41 -
 42
42 -
 43
43 -
 44
44 -
 45
45 -
 46
46 -
 47
47 -
 48
48 -
 49
49 -
50
-
51
-
52
-
53
-
54
-
55
-
56
-
57
-
58
-
59
-
60
-
61
-
62
-
63
-
64
-
65
-
66
-
67
-
68
-
69
-
70
-
71
-
72
-
73
-
74
-
75
-
76
-
77
-
78
-
79
-
80
-
81
-
82
-
83
-
84
-
85
-
86
-
87
-
88
-
89
-
90
-
91
-
92
-
93
-
94
-
95
-
96
-
97
-
98
-
99
-
100
-
101
-
102
-
103
-
104
-
105
-
106
-
107
-
108
-
109
-
110
-
111
-
112
-
113
-
114
-
115
-
116
-
117
-
118
-
119
-
120
-
121
-
122
-
123
-
124
-
125
-
126
-
127
-
128
-
129
-
130
-
131
-
132
-
133
-
134
-
135
-
136
 |
 |

MANAGEMENT’S DISCUSSION AND ANALYSIS
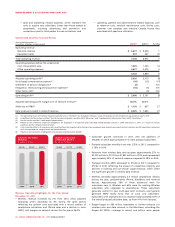
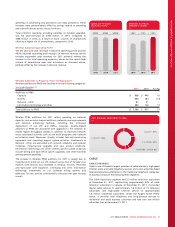
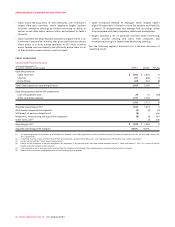
Summarized Cable Financial Results
Years ended December 31,
(In millions of dollars, except margin) 2011(1) 2010(1) % Chg
Operating revenue
Cable Operations(2) $ 3,309 $ 3,190 4
RBS 405 452 (10)
Video 82143 (43)
Total operating revenue 3,796 3,785 –
Adjusted operating profit (loss) before the undernoted
Cable Operations(2) 1,549 1,419 9
RBS 8640 115
Video (23) (33) (30)
Adjusted operating profit(3) 1,612 1,426 13
Stock-based compensation expense(4) (9) (7) 29
Settlement of pension obligations(5) (5) – n/m
Integration, restructuring and acquisition expenses(6) (39) (23) 70
Other items, net(7) –(5) n/m
Operating profit(3) $ 1,559 $ 1,391 12
Adjusted operating profit (loss) margin(3)
Cable Operations(2) 46.8% 44.5%
RBS 21.2%8.8%
Video (28.0%)(23.1%)
Additions to PP&E(3)
Cable Operations(2) $748$ 611 22
RBS 55 38 45
Video –13 n/m
Total additions to PP&E $803 $ 662 21
(1) The operating results of Kincardine Cable T.V. Ltd. (“Kincardine”) and Compton Cable T.V. Ltd. (“Compton”) are included in the Cable Operations results of operations from
the dates of acquisition on July 30, 2010 and February 28, 2011, respectively. The operating results of Blink Communications Inc. (“Blink”) and Atria Networks LP (“Atria”) are
included in the RBS results of operations from the dates of acquisition on January 29, 2010 and January 4, 2011, respectively.
(2) Cable Operations segment includes Cable Television services, Internet services and Home Phone services.
(3) As defined. See the sections entitled “Key Performance Indicators and Non-GAAP Measures” and “Supplementary Information: Non-GAAP Calculations”.
(4) See the section entitled “Stock-based Compensation”.
(5) Relates to the settlement of pension obligations for employees in the pension plans who had retired between January 1, 2009 and January 1, 2011, as a result of annuity
purchases by the Company’s pension plans.
(6) Costs incurred relate to (i) severance costs resulting from the targeted restructuring of our employee base and outsourcing of certain functions; (ii) acquisition transaction
costs incurred and the integration of acquired businesses; and (iii) the closure of certain Video stores and lease exit costs.
(7) Relates to the resolution of obligations and accruals relating to prior periods.
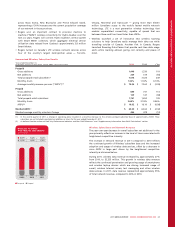
Cable Operating Highlights for the Year Ended
December 31, 2011
• Cable grew high-speed Internet subscribers by 83,000, cable
telephony lines by 45,000 and digital cable households by 39,000.
• Cable’s Internet subscriber base continued to grow during the year
and penetration is approximately 48% of the homes passed by our
cable networks and 78% of our television subscriber base. In
addition, digital penetration now represents approximately 77% of
television households.
• Digital cable subscribers increased 3% from December 31, 2010 to
December 31, 2011, to approximately 1.8 million.
• The cable residential telephony subscriber base continued to grow
ending the year with just over 1 million residential voice-over-cable
telephony lines, which brings the total penetration of cable
telephony lines to 46% of television subscribers at December 31,
2011.
• Cable deployed its popular SpeedBoost technology for high-speed
Internet subscribers which detects available bandwidth on the
network and automatically delivers a temporary burst of speed for
the first 10 MB of a download or stream which loads content faster
and delivers a superior online experience.
2011 ANNUAL REPORT ROGERS COMMUNICATIONS INC. 35