Rogers 2011 Annual Report Download - page 3
Download and view the complete annual report
Please find page 3 of the 2011 Rogers annual report below. You can navigate through the pages in the report by either clicking on the pages listed below, or by using the keyword search tool below to find specific information within the annual report.-
 1
1 -
 2
2 -
 3
3 -
 4
4 -
 5
5 -
 6
6 -
 7
7 -
 8
8 -
 9
9 -
 10
10 -
 11
11 -
 12
12 -
 13
13 -
 14
14 -
15
-
16
-
17
-
18
-
19
-
20
-
21
-
22
-
23
-
24
-
25
-
26
-
27
-
28
-
29
-
30
-
31
-
32
-
33
-
34
-
35
-
36
-
37
-
38
-
39
-
40
-
41
-
42
-
43
-
44
-
45
-
46
-
47
-
48
-
49
-
50
-
51
-
52
-
53
-
54
-
55
-
56
-
57
-
58
-
59
-
60
-
61
-
62
-
63
-
64
-
65
-
66
-
67
-
68
-
69
-
70
-
71
-
72
-
73
-
74
-
75
-
76
-
77
-
78
-
79
-
80
-
81
-
82
-
83
-
84
-
85
-
86
-
87
-
88
-
89
-
90
-
91
-
92
-
93
-
94
-
95
-
96
-
97
-
98
-
99
-
100
-
101
-
102
-
103
-
104
-
105
-
106
-
107
-
108
-
109
-
110
-
111
-
112
-
113
-
114
-
115
-
116
-
117
-
118
-
119
-
120
-
121
-
122
-
123
-
124
-
125
-
126
-
127
-
128
-
129
-
130
-
131
-
132
-
133
-
134
-
135
-
136
 |
 |

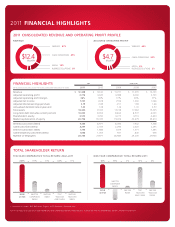
FOR A DETAILED DISCUSSION OF OUR FINANCIAL AND OPERATING METRICS AND RESULTS, PLEASE SEE THE ACCOMPANYING MD&A LATER IN THIS REPORT.
* Comprised of: Rogers, BCE, Bell Aliant, Cogeco, MTS, Quebecor, Shaw and Telus
(IN MILLIONS OF DOLLARS, EXCEPT PER SHARE, SUBSCRIBER AND EMPLOYEE DATA) 2011 2010 2009 2008 2007
Revenue $ 12,428 $ 12,142 $ 11,731 $ 11,335 $ 10,123
Adjusted operating profit 4,716 4,635 4,388 4,060 3,703
Adjusted operating profit margin 38% 38% 37% 36% 37%
Adjusted net income 1,747 1,678 1,556 1,260 1,066
Adjusted diluted earnings per share 3.19 2.89 2.51 1.98 1.66
Annualized dividend rate at year-end 1.42 1.28 1.16 1.00 0.50
Total assets 18,362 17,033 17,018 17,0 82 15, 325
Long-term debt (includes current portion) 10,034 8,654 8,464 8,507 6,033
Shareholders’ equity 3,572 3,760 4,273 4,716 4,624
Market capitalization of equity 20,736 19,435 19,476 23,679 29,614
Wireless subscribers (000s) 9,335 8,977 8,494 7,942 7,338
Cable subscribers (000s) 2,297 2,305 2,296 2,320 2,295
Internet subscribers (000s) 1,793 1,686 1,619 1,571 1,465
Cable telephony subscribers (000s) 1,052 1,003 937 840 656
Number of employees 28,745 27,971 28,985 29,200 27,900
FINANCIAL HIGHLIGHTS
2011 CONSOLIDATED REVENUE AND OPERATING PROFIT PROFILE
REVENUE
$12.4
BILLION
WIRELESS 57%
CABLE OPERATIONS 27%
MEDIA 13%
BUSINESS SOLUTIONS 3%
ADJUSTED OPERATING PROFIT
$4.7
BILLION
TOTAL SHAREHOLDER RETURN
TEN-YEAR COMPARATIVE TOTAL RETURN: 2002–2011 ONE-YEAR COMPARATIVE TOTAL RETURN: 2011
RCI.B
on TSX
241%
S&P/TSX
COMPOSITE
INDEX
97%
S&P 500
INDEX
TSX*
TELECOM
AND CABLE
S&P 500
TELECOM
INDEX
33% 88% 17%
RCI.B
on TSX
18%
S&P/TSX
COMPOSITE
INDEX
(9)%
S&P 500
INDEX
TSX*
TELECOM
AND CABLE
S&P 500
TELECOM
INDEX
2% 16% 6%
2011 FINANCIAL HIGHLIGHTS
WIRELESS 62%
CABLE OPERATIONS 32%
MEDIA 4%
BUSINESS SOLUTIONS 2%
IFRS CDN GAAP