Rogers 2011 Annual Report Download - page 45
Download and view the complete annual report
Please find page 45 of the 2011 Rogers annual report below. You can navigate through the pages in the report by either clicking on the pages listed below, or by using the keyword search tool below to find specific information within the annual report.-
 1
1 -
2
-
3
-
4
-
5
-
6
-
7
-
8
-
9
-
10
-
11
-
12
-
13
-
14
-
15
-
16
-
17
-
18
-
19
-
20
-
21
-
22
-
23
-
24
-
25
-
26
-
27
-
28
-
29
-
30
-
31
-
32
-
33
-
34
-
 35
35 -
 36
36 -
 37
37 -
 38
38 -
 39
39 -
 40
40 -
 41
41 -
 42
42 -
 43
43 -
 44
44 -
 45
45 -
 46
46 -
 47
47 -
 48
48 -
 49
49 -
 50
50 -
 51
51 -
 52
52 -
 53
53 -
 54
54 -
 55
55 -
56
-
57
-
58
-
59
-
60
-
61
-
62
-
63
-
64
-
65
-
66
-
67
-
68
-
69
-
70
-
71
-
72
-
73
-
74
-
75
-
76
-
77
-
78
-
79
-
80
-
81
-
82
-
83
-
84
-
85
-
86
-
87
-
88
-
89
-
90
-
91
-
92
-
93
-
94
-
95
-
96
-
97
-
98
-
99
-
100
-
101
-
102
-
103
-
104
-
105
-
106
-
107
-
108
-
109
-
110
-
111
-
112
-
113
-
114
-
115
-
116
-
117
-
118
-
119
-
120
-
121
-
122
-
123
-
124
-
125
-
126
-
127
-
128
-
129
-
130
-
131
-
132
-
133
-
134
-
135
-
136
 |
 |

MANAGEMENT’S DISCUSSION AND ANALYSIS
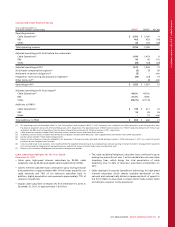
Cable Additions to Property, Plant and Equipment
Cable additions to PP&E are classified into the following categories:
Years ended December 31,
(In millions of dollars) 2011 2010 % Chg
Additions to PP&E
Customer premise equipment $ 225 $ 234 (4)
Scalable infrastructure 267 201 33
Line extensions 47 43 9
Upgrades and rebuild 13 20 (35)
Support capital 196 113 73
Total Cable Operations 748611 22
RBS 55 38 45
Video –13 n/m
Total additions to PP&E $803 $ 662 21
The Cable Operations segment categorizes its PP&E expenditures
according to a standardized set of reporting categories that were
developed and agreed to by the U.S. cable television industry and
that facilitate comparisons of additions to PP&E between different
cable companies. Under these industry definitions, Cable Operations
additions to PP&E are classified into the following five categories:
• Customer premise equipment (“CPE”), which includes the
equipment for digital set-top terminals, Internet modems and
associated installation costs;
• Scalable infrastructure, which includes non-CPE costs to meet
business growth and to provide service enhancements;
• Line extensions, which includes network costs to enter new service
areas;
• Upgrades and rebuild, which includes the costs to modify or
replace existing co-axial cable, fibre-optic equipment and network
electronics; and
• Support capital, which includes the costs associated with the
purchase, replacement or enhancement of non-network assets.
Additions to Cable PP&E include continued investments in the cable
network to continue to enhance the customer experience through
increased speed and performance of our Internet service and capacity
enhancements to our digital network to allow for incremental HD
and on-demand services to be added.
The increase in Cable Operations PP&E for 2011, resulted from higher
scalable infrastructure and support capital expenditures due to
projects associated with quality related investments on IPv6
compliance initiatives, timing of spend on infrastructure projects and
development work on new video platform capabilities. Support
capital investments that contributed to the increase relate to
customer billing systems and platforms for new services. Lower
investments in set top boxes due to lower subscriber activity and
lower unit pricing contributed to the decrease in Customer premise
equipment for 2011.
The increase in RBS PP&E additions for 2011 reflects increased activity
and timing of expenditures on customer networks and support
capital.
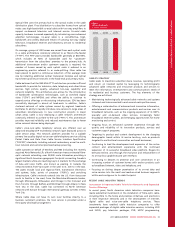
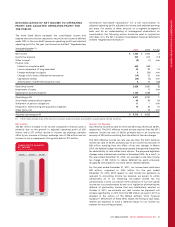
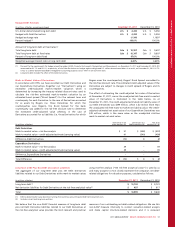
(%)
2011 CABLE OPERATIONS ADDITIONS TO PP&E
CUSTOMER PREMISE
EQUIPMENT 30%
SUPPORT CAPITAL 26%
LINE EXTENSIONS 6%
UPGRADES AND
REBUILD 2%
SCALABLE
INFRESTRUCTURE 36%
MEDIA
MEDIA’S BUSINESS
Media operates our television and radio broadcasting assets,
consumer and trade publications, nationally-televised home shopping
service and Sports Entertainment. Media is also focused on the
explosive growth in digital properties and has invested significantly in
infrastructure and people to grow our digital operations by
producing and acquiring content for our on-line and mobile
platforms, selling advertising on behalf of other digital content
providers and operating e-commerce businesses.
Media’s broadcasting group (“Broadcasting”) comprises 55 radio
stations across Canada; the multicultural OMNI broadcast television
stations; the five-station Citytv broadcast television network; specialty
sports television services including Sportsnet, Sportsnet ONE and
Sportsnet World; other specialty services including Outdoor Life
Network, The Biography Channel (Canada), FX (Canada), G4 Canada,
and CityNews Channel; and The Shopping Channel, Canada’s only
nationally televised shopping service. Broadcasting also owns 50% of
Dome Productions, Canada’s leader in HD mobile sports and events
production and distribution services.
2011 ANNUAL REPORT ROGERS COMMUNICATIONS INC. 41