Rogers 2011 Annual Report Download - page 123
Download and view the complete annual report
Please find page 123 of the 2011 Rogers annual report below. You can navigate through the pages in the report by either clicking on the pages listed below, or by using the keyword search tool below to find specific information within the annual report.-
 1
1 -
2
-
3
-
4
-
5
-
6
-
7
-
8
-
9
-
10
-
11
-
12
-
13
-
14
-
15
-
16
-
17
-
18
-
19
-
20
-
21
-
22
-
23
-
24
-
25
-
26
-
27
-
28
-
29
-
30
-
31
-
32
-
33
-
34
-
35
-
36
-
37
-
38
-
39
-
40
-
41
-
42
-
43
-
44
-
45
-
46
-
47
-
48
-
49
-
50
-
51
-
52
-
53
-
54
-
55
-
56
-
57
-
58
-
59
-
60
-
61
-
62
-
63
-
64
-
65
-
66
-
67
-
68
-
69
-
70
-
71
-
72
-
73
-
74
-
75
-
76
-
77
-
78
-
79
-
80
-
81
-
82
-
83
-
84
-
85
-
86
-
87
-
88
-
89
-
90
-
91
-
92
-
93
-
94
-
95
-
96
-
97
-
98
-
99
-
100
-
101
-
102
-
103
-
104
-
105
-
106
-
107
-
108
-
109
-
110
-
111
-
112
-
 113
113 -
 114
114 -
 115
115 -
 116
116 -
 117
117 -
 118
118 -
 119
119 -
 120
120 -
 121
121 -
 122
122 -
 123
123 -
 124
124 -
 125
125 -
 126
126 -
 127
127 -
 128
128 -
 129
129 -
 130
130 -
 131
131 -
 132
132 -
 133
133 -
134
-
135
-
136
 |
 |

NOTES TO CONSOLIDATED FINANCIAL STATEMENTS
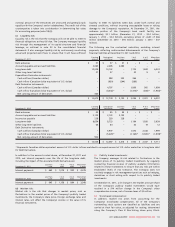
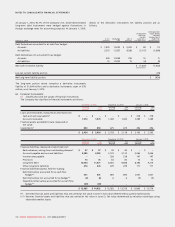
(b) Allocation of plan assets:
Percentage of plan assets Target asset
allocation
percentageAsset category December 31,
2011 December 31,
2010 January 1,
2010
Equity securities:
Domestic 19.0%18.6% 18.6% 10% to 29%
International 37.7%40.3% 39.9% 29% to 48%
Debt securities 42.4%40.5% 40.1% 38% to 47%
Other – cash 0.9%0.6% 1.4% 0% to 2%
100.0%100.0% 100.0%
Plan assets are comprised primarily of pooled funds that invest in
common stocks and bonds. The pooled Canadian equity fund has
investments in the Company’s equity securities comprising
approximately 1% of the pooled fund. This results in approximately
$1 million (December 31, 2010 – $1 million; January 1, 2010 –
$1 million) of the plans’ assets being indirectly invested in the
Company’s equity securities.
The Company makes contributions to the plans to secure the benefits
of plan members and invests in permitted investments using the
target ranges established by the Pension Committee of the Company.
The Pension Committee reviews actuarial assumptions on an annual
basis.
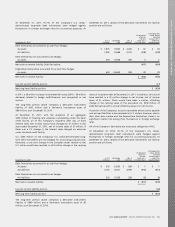
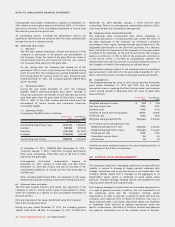
(c) Actual contributions to the plans for the years ended
December 31 are as follows:
Employer Employee Total
2011 $ 80 $ 20 $ 100
2010 60 21 81
Expected contributions by the Company in 2012 are estimated to be
$73 million.
Employee contributions for 2012 are assumed to be at levels similar to
2011 on the assumption staffing levels in the Company will remain
the same on a year-over-year basis.
(d) Settlement of pension obligations:
During 2011, the Company made a lump-sum contribution of
$18 million to its pension plans, following which the pension plans
purchased annuities from insurance companies for all employees who
had retired during the period from January 1, 2009 to January 1,
2011. The purchase of the annuities relieves the Company of primary
responsibility for, and eliminates significant risk associated with, the
accrued benefit obligations for the retired employees. This
transaction resulted in a non-cash loss from the settlement of pension
obligations of approximately $11 million recorded in operating costs
on the consolidated statement of income.
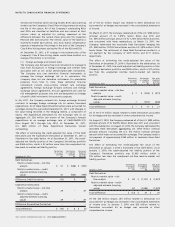
(e) Historical information:
History of annual experience (gains) and losses:
December 31,
2011 December 31,
2010
Funded plan:
Actuarial loss on plan liabilities $90 $82
Effect of asset ceiling limit (2) (4)
Total loss recognized in OCI 88 78
Unfunded plan:
Total loss recognized in OCI 12
Cumulative loss recognized in OCI $89$80
Actual return on plan assets was $27 million in 2011 (2010 – $61 million).
The Company’s experience loss (gain) on funded plan liabilities was
$16 million in 2011 (2010 – $(24) million), and the Company’s
experience loss (gain) on unfunded plan liabilities was $1 million in
2011 (2010 – $(1) million).
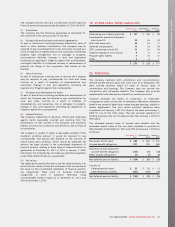
History of obligation and assets:
December 31,
2011 December 31,
2010 January 1,
2010
Funded plan:
Benefit obligation $817 $ 728 $ 569
Fair value of plan assets 684652 541
Deficit $ (133) $ (76) $ (28)
Unfunded plan:
Benefit obligation $39 $36$32
Fair value of plan assets –––
Deficit $ (39) $ (36) $ (32)
As the Company is a first-time adopter of IFRS, the Company is
disclosing the history of obligation and assets prospectively from the
Transition Date.
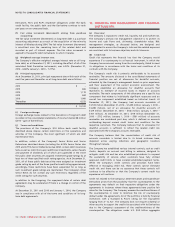
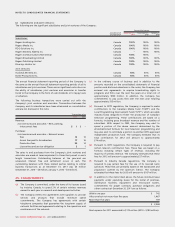
21. SHAREHOLDERS’ EQUITY:
(a) Capital stock:
(i) Preferred shares:
Rights and conditions:
There are 400 million authorized preferred shares without par
value, issuable in series, with rights and terms of each series to
be fixed by the Board of Directors prior to the issue of such
series. The preferred shares have no rights to vote at any general
meeting of the Company.
(ii) Common shares:
Rights and conditions:
There are 112,474,388 authorized Class A Voting shares without
par value. Each Class A Voting share is entitled to 50 votes. The
Class A Voting shares are convertible on a one-for-one basis into
Class B Non-Voting shares.
There are 1.4 billion authorized Class B Non-Voting shares
without par value.
The Articles of Continuance of the Company under the Company
Act (British Columbia) impose restrictions on the transfer, voting
and issue of the Class A Voting and Class B Non-Voting shares in
order to ensure that the Company remains qualified to hold or
obtain licences required to carry on certain of its business
undertakings in Canada.
2011 ANNUAL REPORT ROGERS COMMUNICATIONS INC. 119