Rogers 2011 Annual Report Download - page 26
Download and view the complete annual report
Please find page 26 of the 2011 Rogers annual report below. You can navigate through the pages in the report by either clicking on the pages listed below, or by using the keyword search tool below to find specific information within the annual report.-
 1
1 -
2
-
3
-
4
-
5
-
6
-
7
-
8
-
9
-
10
-
11
-
12
-
13
-
14
-
15
-
 16
16 -
 17
17 -
 18
18 -
 19
19 -
 20
20 -
 21
21 -
 22
22 -
 23
23 -
 24
24 -
 25
25 -
 26
26 -
 27
27 -
 28
28 -
 29
29 -
 30
30 -
 31
31 -
 32
32 -
 33
33 -
 34
34 -
 35
35 -
 36
36 -
37
-
38
-
39
-
40
-
41
-
42
-
43
-
44
-
45
-
46
-
47
-
48
-
49
-
50
-
51
-
52
-
53
-
54
-
55
-
56
-
57
-
58
-
59
-
60
-
61
-
62
-
63
-
64
-
65
-
66
-
67
-
68
-
69
-
70
-
71
-
72
-
73
-
74
-
75
-
76
-
77
-
78
-
79
-
80
-
81
-
82
-
83
-
84
-
85
-
86
-
87
-
88
-
89
-
90
-
91
-
92
-
93
-
94
-
95
-
96
-
97
-
98
-
99
-
100
-
101
-
102
-
103
-
104
-
105
-
106
-
107
-
108
-
109
-
110
-
111
-
112
-
113
-
114
-
115
-
116
-
117
-
118
-
119
-
120
-
121
-
122
-
123
-
124
-
125
-
126
-
127
-
128
-
129
-
130
-
131
-
132
-
133
-
134
-
135
-
136
 |
 |

MANAGEMENT’S DISCUSSION AND ANALYSIS
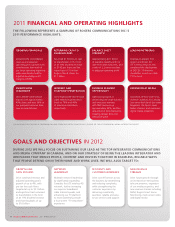
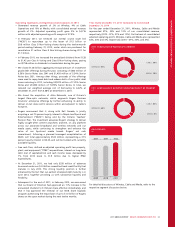
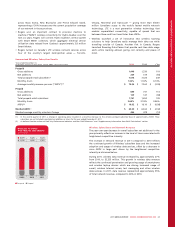
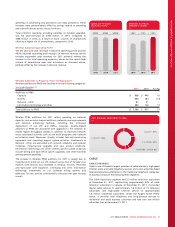
Wireless Cable Media
(In millions of dollars)
SEGMENT REVENUE
3,948 3,785 3,796
6,654 6,973 7,138
1,407 1,461 1,611
2009 20102011
Wireless Cable Media
(In millions of dollars)
SEGMENT ADJUSTED
OPERATING PROFIT
1,324 1,4261,612
3,042 3,173 3,036
119131180
2009 20102011
OUR STRATEGY
Our business objective is to maximize subscribers, revenue, operating
profit and return on invested capital by enhancing our position as
one of Canada’s leading diversified communications and media
companies. Our strategy is to be the leading and preferred provider
of innovative communications, entertainment and information
services to Canadians. We seek to leverage our advanced networks,
infrastructure, sales channels, brands and marketing resources across
the Rogers group of companies by implementing cross-selling and
joint sales distribution initiatives as well as cost reduction initiatives
through infrastructure sharing, to create value for our customers and
shareholders.
We seek to exploit opportunities for Wireless, Cable and Media to
create bundled product and service offerings at attractive prices, in
addition to implementing cross-marketing and cross-promotion of
products and services to increase sales and enhance subscriber loyalty.
We also work to identify and implement areas of opportunity for our
businesses that will enhance operating efficiencies by sharing
infrastructure, corporate services and sales distribution channels. We
continue to develop brand awareness and promote the “Rogers”
brand as a symbol of quality and innovation.
Our Cable and Wireless businesses are integrated in our
Communications Services organization. This more streamlined
organizational structure is intended to facilitate faster time to
market, deliver an enhanced and more consistent customer
experience, and improve the overall effectiveness and efficiency of
the Wireless and Cable businesses. This more integrated operating
approach also recognizes the continued convergence of certain
aspects of wireless and wireline networks and services.
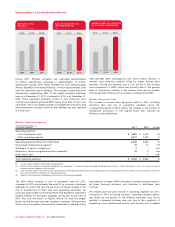
(In millions of dollars)
ADDITIONS TO
CONSOLIDATED PP&E
$1,855 $1,834 $2,127
2009 20102011
(In millions of dollars)
CONSOLIDATED
TOTAL ASSETS
$17,018$17,033 $18,362
2009 20102011
CONSOLIDATED FINANCIAL AND OPERATING RESULTS
See the sections in this MD&A entitled “Critical Accounting Policies”,
“Critical Accounting Estimates” and “New Accounting Standards” and
also the Notes to the 2011 Audited Consolidated Financial Statements
for a discussion of critical and new accounting policies and estimates
as they relate to the discussion of our operating and financial results
below.
We measure the success of our strategies using a number of key
performance indicators as outlined in the section entitled “Key
Performance Indicators and Non-GAAP Measures”. These key
performance indicators are not measurements in accordance with IFRS
or Canadian GAAP and should not be considered as alternative
measures to net income or any other measure of performance under
IFRS or Canadian GAAP. The non-GAAP measures presented in this
MD&A include, among other measures, operating profit, adjusted
operating profit, adjusted operating profit margin, adjusted net
income, adjusted basic and diluted earnings per share and free cash
flow. We believe that the non-GAAP financial measures provided,
which exclude: (i) stock-based compensation expense (recovery);
(ii) integration, restructuring and acquisition expenses; (iii) settlement
of pension obligations; (iv) other items, net; and (v) in respect of net
income and earnings per share, loss on repayment of long-term debt,
impairment of assets and the related income tax impacts of the above
items, provide for a more effective analysis of our operating
performance. See the sections entitled “Key Performance Indicators
and Non-GAAP Measures” and “Supplementary Information:
Non-GAAP Calculations” for further details.
The increased levels of competitive intensity have negatively impacted
the results of our Wireless and Cable businesses during 2011. This
includes higher subscriber churn and lower average revenue per user
(“ARPU”) at Wireless and a slowing in the number of new subscriber
additions and increased promotional and retention activity at Cable.
During the first half of 2011, Media benefited from a rebound in the
advertising market which again slowed in the later parts of the year.
We recognized cost efficiencies during 2011 as a result of certain
restructuring of our organization and employee base in some areas to
improve our organizational efficiency and cost structure.
We believe that we are well-positioned from both a leverage and a
liquidity perspective with a debt to adjusted operating profit ratio of
2.2 times. In addition, we had borrowed only $250 million from our
$2.4 billion fully committed multi-year bank credit facility at
December 31, 2011 and we have no scheduled debt maturities until
June 2013.
22 ROGERS COMMUNICATIONS INC. 2011 ANNUAL REPORT