Rogers 2011 Annual Report Download - page 109
Download and view the complete annual report
Please find page 109 of the 2011 Rogers annual report below. You can navigate through the pages in the report by either clicking on the pages listed below, or by using the keyword search tool below to find specific information within the annual report.-
 1
1 -
2
-
3
-
4
-
5
-
6
-
7
-
8
-
9
-
10
-
11
-
12
-
13
-
14
-
15
-
16
-
17
-
18
-
19
-
20
-
21
-
22
-
23
-
24
-
25
-
26
-
27
-
28
-
29
-
30
-
31
-
32
-
33
-
34
-
35
-
36
-
37
-
38
-
39
-
40
-
41
-
42
-
43
-
44
-
45
-
46
-
47
-
48
-
49
-
50
-
51
-
52
-
53
-
54
-
55
-
56
-
57
-
58
-
59
-
60
-
61
-
62
-
63
-
64
-
65
-
66
-
67
-
68
-
69
-
70
-
71
-
72
-
73
-
74
-
75
-
76
-
77
-
78
-
79
-
80
-
81
-
82
-
83
-
84
-
85
-
86
-
87
-
88
-
89
-
90
-
91
-
92
-
93
-
94
-
95
-
96
-
97
-
98
-
 99
99 -
 100
100 -
 101
101 -
 102
102 -
 103
103 -
 104
104 -
 105
105 -
 106
106 -
 107
107 -
 108
108 -
 109
109 -
 110
110 -
 111
111 -
 112
112 -
 113
113 -
 114
114 -
 115
115 -
 116
116 -
 117
117 -
 118
118 -
 119
119 -
120
-
121
-
122
-
123
-
124
-
125
-
126
-
127
-
128
-
129
-
130
-
131
-
132
-
133
-
134
-
135
-
136
 |
 |

NOTES TO CONSOLIDATED FINANCIAL STATEMENTS
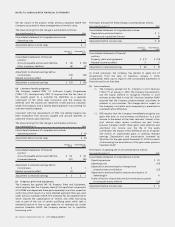
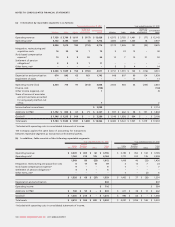
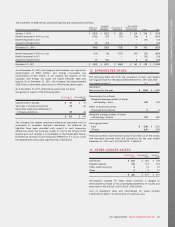
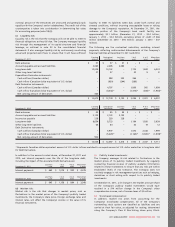
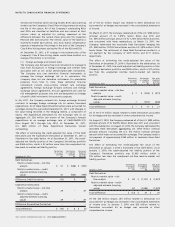
The movement of deferred tax assets and liabilities are summarized as follows:
Deferred tax assets (liabilities) PP&E and
Inventory
Goodwill
and other
intangibles Investment in
Partnership
Non-capital
income tax loss
carryforwards Other Total
January 1, 2010 $ (263) $ (323) $ (61) $ 124 $ 316 $ (207)
Benefit (expense) in Profit or Loss (199) (27) (77) (70) 6 (367)
Benefit (expense) in OCI – – – – (17) (17)
Acquisitions/dispositions (2) (10) – – – (12)
December 31, 2010 (464) (360) (138) 54 305 (603)
Benefit (expense) in Profit or Loss (18) (8) (727) 105 (33) (681)
Benefit (expense) in OCI – – – – (21) (21)
Acquisitions/dispositions (2) (53) – 3 (3) (55)
December 31, 2011 $ (484) $ (421) $ (865) $ 162 $ 248 $ (1,360)
As at December 31, 2011, the Company had Canadian non-capital loss
carryforwards of $583 million, and foreign non-capital loss
carryforwards of $61 million. If not utilized, the majority of the
Canadian and foreign tax losses will expire between 2026 and
beyond. As at December 31, 2011, the Company had approximately
$228 million of available capital losses to offset future capital gains.
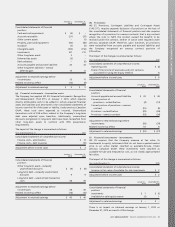
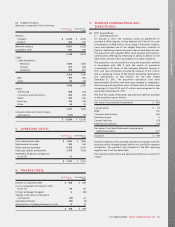
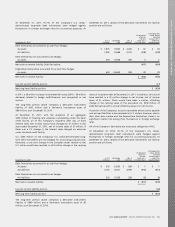
As at December 31, 2011, deferred tax assets have not been
recognized in respect of the following items:
December 31,
2011 December 31,
2010
Capital losses in Canada $41 $41
Tax losses in foreign jurisdictions 45 62
Deductible temporary differences in
foreign jurisdictions 45 44
$ 131 $ 147
The Company has taxable temporary differences associated with its
investment in Canadian domestic subsidiaries. No deferred tax
liabilities have been provided with respect to such temporary
differences where the Company is able to control the timing of the
reversal and such reversal is not probable in the foreseeable future.
Furthermore, reversal of such temporary differences, if it occurs, could
be implemented without any significant tax implications.
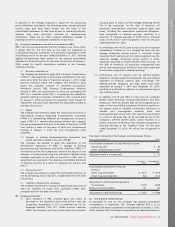
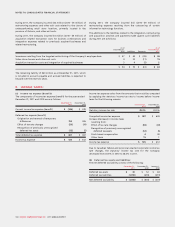
10. EARNINGS PER SHARE:
The following table sets forth the calculation of basic and diluted
earnings per share for the years ended December 31, 2011 and 2010:
Years ended December 31, 2011 2010
Numerator:
Net income for the year $ 1,563 $ 1,502
Denominator (in millions):
Weighted average number of shares
outstanding – basic 543 576
Effect of dilutive securities:
Employee stock options 44
Weighted average number of shares
outstanding – diluted 547 580
Earnings per share:
Basic $2.88 $ 2.61
Diluted 2.862.59
The total number of anti-dilutive options that were out of the money
and therefore excluded from the calculation for the year ended
December 31, 2011 was 1,570,760 (2010 – 1,406,013).
11. OTHER CURRENT ASSETS:
December 31,
2011 December 31,
2010 January 1,
2010
Inventories $ 206 $ 185 $ 129
Prepaid expenses 108113 110
Video rental inventory 614 27
Other 2311
$ 322 $ 315 $ 277
Amortization expense for Video rental inventory is charged to
merchandise for resale in the consolidated statements of income and
amounted to $26 million in 2011 (2010 – $54 million).
Cost of equipment sales and merchandise for resale includes
$1,637 million (2010 – $1,472 million) of inventory costs.
2011 ANNUAL REPORT ROGERS COMMUNICATIONS INC. 105