Rogers 2011 Annual Report Download - page 104
Download and view the complete annual report
Please find page 104 of the 2011 Rogers annual report below. You can navigate through the pages in the report by either clicking on the pages listed below, or by using the keyword search tool below to find specific information within the annual report.-
 1
1 -
2
-
3
-
4
-
5
-
6
-
7
-
8
-
9
-
10
-
11
-
12
-
13
-
14
-
15
-
16
-
17
-
18
-
19
-
20
-
21
-
22
-
23
-
24
-
25
-
26
-
27
-
28
-
29
-
30
-
31
-
32
-
33
-
34
-
35
-
36
-
37
-
38
-
39
-
40
-
41
-
42
-
43
-
44
-
45
-
46
-
47
-
48
-
49
-
50
-
51
-
52
-
53
-
54
-
55
-
56
-
57
-
58
-
59
-
60
-
61
-
62
-
63
-
64
-
65
-
66
-
67
-
68
-
69
-
70
-
71
-
72
-
73
-
74
-
75
-
76
-
77
-
78
-
79
-
80
-
81
-
82
-
83
-
84
-
85
-
86
-
87
-
88
-
89
-
90
-
91
-
92
-
93
-
 94
94 -
 95
95 -
 96
96 -
 97
97 -
 98
98 -
 99
99 -
 100
100 -
 101
101 -
 102
102 -
 103
103 -
 104
104 -
 105
105 -
 106
106 -
 107
107 -
 108
108 -
 109
109 -
 110
110 -
 111
111 -
 112
112 -
 113
113 -
 114
114 -
115
-
116
-
117
-
118
-
119
-
120
-
121
-
122
-
123
-
124
-
125
-
126
-
127
-
128
-
129
-
130
-
131
-
132
-
133
-
134
-
135
-
136
 |
 |

NOTES TO CONSOLIDATED FINANCIAL STATEMENTS
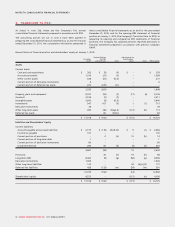
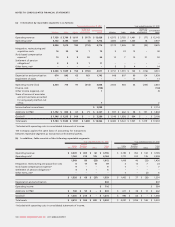
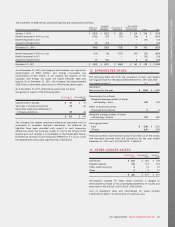
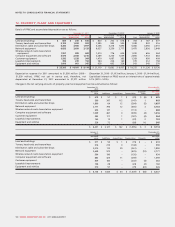
(a) Information by reportable segments is as follows:
Year ended December 31, 2011 Year ended December 31, 2010
Wireless Cable Media
Corporate
items and
eliminations Consolidated
totals Wireless Cable Media
Corporate
items and
eliminations Consolidated
totals
Operating revenue $ 7,138$ 3,796 $ 1,611 $ (117) $ 12,428$ 6,973 $ 3,785 $ 1,461 $ (77) $ 12,142
Operating costs* 4,102 2,184 1,431 (5) 7,712 3,800 2,359 1,330 18 7,507
3,036 1,612 180 (112) 4,716 3,173 1,426 131 (95) 4,635
Integration, restructuring and
acquisition costs 16 39 14 1 70 52312 – 40
Stock-based compensation
expense* 10 9 9 36 64 12 7 10 21 50
Settlement of pension
obligations* 253 1 11 ––– – –
Other items, net* ––– – – 554 – 14
$ 3,008$ 1,559 $ 154 $ (150) 4,571 $ 3,151 $ 1,391 $ 105 $ (116) 4,531
Depreciation and amortization 674 843 63 163 1,743 648 807 60 124 1,639
Impairment of assets ––– – – – – 11 – 11
Operating income (loss) 2,334 716 91 (313) 2,8282,503 584 34 (240) 2,881
Finance costs (738)(768)
Other income (expense), net 1(1)
Share of income of associates
and joint ventures accounted
for using equity method, net
of tax 72
Income before income taxes $ 2,098$ 2,114
Additions to PP&E $ 1,192 $ 803 $ 61 $ 71 $ 2,127 $ 937 $ 662 $ 38 $ 197 $ 1,834
Goodwill $ 1,146 $ 1,215 $ 919 $ – $ 3,280$ 1,146 $ 1,058 $ 904 $ – $ 3,108
Total assets $ 9,184 $ 5,543 $ 1,947 $ 1,688 $18,362 $ 8,485 $ 5,322 $ 1,907 $ 1,319 $ 17,033
*Included with operating costs in consolidated statements of income.
The Company applies the same basis of accounting for transactions
between reportable segments as transactions with external parties.
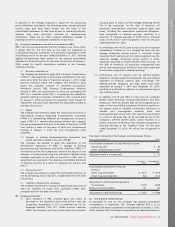
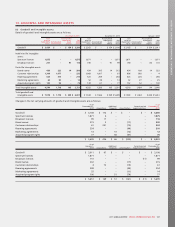
(b) In addition, Cable consists of the following reportable segments:
Year ended December 31, 2011 Year ended December 31, 2010
Cable
Operations
Rogers
Business
Solutions Video Total
Cable Cable
Operations
Rogers
Business
Solutions Video Total
Cable
Operating revenue $ 3,309 $ 405 $ 82 $ 3,796 $ 3,190 $ 452 $ 143 $ 3,785
Operating costs* 1,760 319 105 2,1841,771 412 176 2,359
1,549 86 (23) 1,612 1,419 40 (33) 1,426
Integration, restructuring and acquisition costs 817 14 39 313723
Stock-based compensation expense* 9–– 9 7––7
Settlement of pension obligations* 41– 5 ––––
Other items, net* ––– – 7 – (2) 5
$ 1,528$68$ (37) 1,559 $ 1,402 $ 27 $ (38) 1,391
Depreciation and amortization 843 807
Operating income $ 716 $ 584
Additions to PP&E $748$55$ –$ 803 $ 611 $ 38 $ 13 $ 662
Goodwill $ 1,000 $ 215 $ – $ 1,215 $ 992 $ 66 $ – $ 1,058
Total assets $ 4,410 $ 924 $ 209 $ 5,543 $ 4,097 $ 1,056 $ 169 $ 5,322
*Included with operating costs in consolidated statements of income.
100 ROGERS COMMUNICATIONS INC. 2011 ANNUAL REPORT