Rogers 2011 Annual Report Download - page 76
Download and view the complete annual report
Please find page 76 of the 2011 Rogers annual report below. You can navigate through the pages in the report by either clicking on the pages listed below, or by using the keyword search tool below to find specific information within the annual report.-
 1
1 -
2
-
3
-
4
-
5
-
6
-
7
-
8
-
9
-
10
-
11
-
12
-
13
-
14
-
15
-
16
-
17
-
18
-
19
-
20
-
21
-
22
-
23
-
24
-
25
-
26
-
27
-
28
-
29
-
30
-
31
-
32
-
33
-
34
-
35
-
36
-
37
-
38
-
39
-
40
-
41
-
42
-
43
-
44
-
45
-
46
-
47
-
48
-
49
-
50
-
51
-
52
-
53
-
54
-
55
-
56
-
57
-
58
-
59
-
60
-
61
-
62
-
63
-
64
-
65
-
 66
66 -
 67
67 -
 68
68 -
 69
69 -
 70
70 -
 71
71 -
 72
72 -
 73
73 -
 74
74 -
 75
75 -
 76
76 -
 77
77 -
 78
78 -
 79
79 -
 80
80 -
 81
81 -
 82
82 -
 83
83 -
 84
84 -
 85
85 -
 86
86 -
87
-
88
-
89
-
90
-
91
-
92
-
93
-
94
-
95
-
96
-
97
-
98
-
99
-
100
-
101
-
102
-
103
-
104
-
105
-
106
-
107
-
108
-
109
-
110
-
111
-
112
-
113
-
114
-
115
-
116
-
117
-
118
-
119
-
120
-
121
-
122
-
123
-
124
-
125
-
126
-
127
-
128
-
129
-
130
-
131
-
132
-
133
-
134
-
135
-
136
 |
 |
MANAGEMENT’S DISCUSSION AND ANALYSIS
SUMMARY OF SEASONALITY AND QUARTERLY RESULTS
Quarterly results and statistics for the previous eight quarters are
outlined following this section.
Our operating results are subject to seasonal fluctuations that
materially impact quarter-to-quarter operating results. As a result,
one quarter’s operating results are not necessarily indicative of what
a subsequent quarter’s operating results will be. Each of Wireless,
Cable and Media has unique seasonal aspects to its business.
Wireless’ operating results are subject to seasonal fluctuations that
materially impact quarter-to-quarter operating results. In particular,
operating results may be influenced by the timing of our marketing
and promotional expenditures and higher levels of subscriber
additions and subsidies, resulting in higher subscriber acquisition and
activation-related expenses in certain periods.
The operating results of Cable Operations services are subject to
modest seasonal fluctuations in subscriber additions and
disconnections, which are largely attributable to movements of
university and college students and individuals temporarily
suspending service due to extended vacations, or seasonal relocations,
as well as our concentrated marketing efforts generally conducted
during the fourth quarter. Video operations may also experience
modest fluctuations from quarter-to-quarter due to the availability
and timing of release of popular titles throughout the year. RBS does
not have any unique seasonal aspects to its business.
The seasonality at Media is a result of fluctuations in advertising and
related retail cycles, since they relate to periods of increased
consumer activity as well as fluctuations associated with the Major
League Baseball season, where revenues and expenses are generally
concentrated in the spring, summer and fall months.
In addition to the seasonal trends, revenue and operating profit can
fluctuate from general economic conditions.
Wireless revenue and operating profit trends reflect the increasing
number of wireless voice and data subscribers and increased handset
subsidies as a result of a consumer shift towards smartphones, and a
decrease in blended ARPU. Wireless has continued its strategy of
targeting higher value postpaid subscribers and selling prepaid
handsets at higher price points, which has also contributed over time
to the significantly heavier mix of postpaid versus prepaid subscribers.
Meanwhile, the successful growth in customer base and increased
market penetration have been met by increasing customer service and
retention expenses and increasing credit and collection costs.
However, these costs have been offset by operating efficiencies and
increasing roaming revenues from our subscribers travelling outside
of Canada, as well as strong growth in roaming revenues from visitors
to Canada utilizing our GSM network.
Cable Operations services revenue and operating profit increased
primarily due to price increases, increased penetration of its digital
products and incremental programming packages, and the scaling
and rapid growth of our cable telephony service. Similarly, the steady
growth of Internet revenues has been the result of a greater
penetration of Internet subscribers as a percentage of homes passed.
RBS’s operating profit margin reflects the pricing pressures on long-
distance and higher carrier costs, with an increase in lower margin
long-distance revenue. Video revenue has decreased as a result of a
continued decline in video rental and sales activity.
Media’s results are generally attributable to continuous investment in
prime time programming, increased subscriber fees and
improvements in the advertising and consumer market. The launch of
Sportsnet World, Sportsnet Magazine, CityNews and FX (Canada)
during 2011 also resulted in incremental costs and revenue.
Other fluctuations in net income from quarter-to-quarter can also be
attributed to losses on repayment of debt, foreign exchange gains or
losses, changes in the fair value of derivative instruments, other
income and expenses, impairment of assets and changes in income tax
expense.
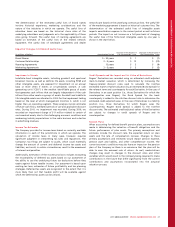
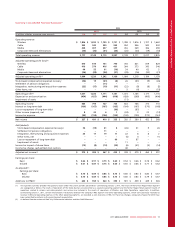
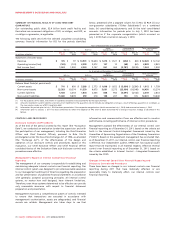
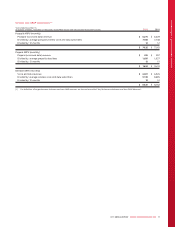
Summary of Fourth Quarter 2011 Results
During the three months ended December 31, 2011, consolidated
operating revenue increased 1% to $3,177 million compared to
$3,138 million in the corresponding period in 2010, arising from Cable
Operations revenue growth of 3%, and Media revenue growth of 3%
while Wireless network revenue remained flat. Consolidated fourth
quarter adjusted operating profit increased 3% year-over-year to
$1,094 million, with 14% growth at Cable and 83% growth at Media,
offset by a 5% decline at Wireless.
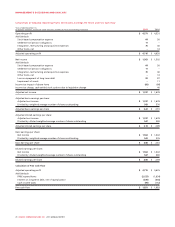
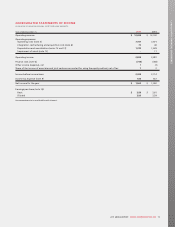
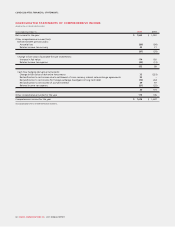
Consolidated operating income for the three months ended
December 31, 2011 totalled $583 million, compared to $633 million in
the corresponding period of 2010.
We recorded net income of $327 million for the three months ended
December 31, 2011, with basic and diluted earnings per share of $0.62
and $0.61, respectively, compared to a net income of $302 million
with basic and diluted earnings per share of $0.54 and $0.50,
respectively, in the corresponding period of 2010.
72 ROGERS COMMUNICATIONS INC. 2011 ANNUAL REPORT