Rogers 2011 Annual Report Download - page 117
Download and view the complete annual report
Please find page 117 of the 2011 Rogers annual report below. You can navigate through the pages in the report by either clicking on the pages listed below, or by using the keyword search tool below to find specific information within the annual report.-
 1
1 -
2
-
3
-
4
-
5
-
6
-
7
-
8
-
9
-
10
-
11
-
12
-
13
-
14
-
15
-
16
-
17
-
18
-
19
-
20
-
21
-
22
-
23
-
24
-
25
-
26
-
27
-
28
-
29
-
30
-
31
-
32
-
33
-
34
-
35
-
36
-
37
-
38
-
39
-
40
-
41
-
42
-
43
-
44
-
45
-
46
-
47
-
48
-
49
-
50
-
51
-
52
-
53
-
54
-
55
-
56
-
57
-
58
-
59
-
60
-
61
-
62
-
63
-
64
-
65
-
66
-
67
-
68
-
69
-
70
-
71
-
72
-
73
-
74
-
75
-
76
-
77
-
78
-
79
-
80
-
81
-
82
-
83
-
84
-
85
-
86
-
87
-
88
-
89
-
90
-
91
-
92
-
93
-
94
-
95
-
96
-
97
-
98
-
99
-
100
-
101
-
102
-
103
-
104
-
105
-
106
-
 107
107 -
 108
108 -
 109
109 -
 110
110 -
 111
111 -
 112
112 -
 113
113 -
 114
114 -
 115
115 -
 116
116 -
 117
117 -
 118
118 -
 119
119 -
 120
120 -
 121
121 -
 122
122 -
 123
123 -
 124
124 -
 125
125 -
 126
126 -
 127
127 -
128
-
129
-
130
-
131
-
132
-
133
-
134
-
135
-
136
 |
 |

NOTES TO CONSOLIDATED FINANCIAL STATEMENTS
notional amount of the Derivatives are unsecured and generally rank
equally with the Company’s senior indebtedness. The credit risk of the
counterparties is taken into consideration in determining fair value
for accounting purposes (note 18(d)).
(c) Liquidity risk:
Liquidity risk is the risk that the Company will not be able to meet its
financial obligations as they fall due. The Company manages liquidity
risk through the management of its capital structure and financial
leverage, as outlined in note 23 to the consolidated financial
statements. It also manages liquidity risk by continuously monitoring
actual and projected cash flows to ensure that it will have sufficient
liquidity to meet its liabilities when due, under both normal and
stressed conditions, without incurring unacceptable losses or risking
damage to the Company’s reputation. At December 31, 2011, the
undrawn portion of the Company’s bank credit facility was
approximately $2.1 billion (December 31, 2010 – $2.4 billion;
January 1, 2010 – $2.4 billion), excluding letters of credit of $66
million (December 31, 2010 – $94 million; January 1, 2010 – $47
million).
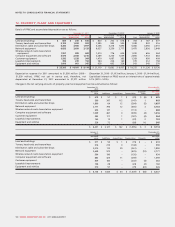
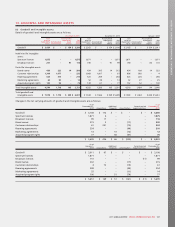
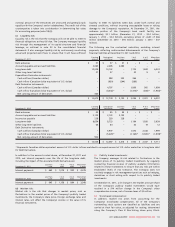
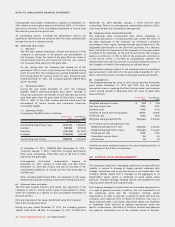
The following are the contractual maturities, excluding interest
payments, reflecting undiscounted disbursements of the Company’s
financial liabilities at December 31, 2011 and 2010:
December 31, 2011 Carrying
amount Contractual
cash flows Less than
1 year 1to3
years 4to5
years More than
5 years
Bank advances $ 57 $ 57 $ 57 $ – $ – $ –
Accounts payable and accrued liabilities 2,085 2,085 2,085 – – –
Long-term debt 10,034 10,102 – 1,725 1,844 6,533
Other long-term liabilities 37 37 – 20 9 8
Expenditure Derivative instruments:
Cash outflow (Canadian dollar) – 598 232 366 – –
Cash inflow (Canadian dollar equivalent of U.S. dollar) – (630) (244) (386) – –
Debt Derivative instruments:
Cash outflow (Canadian dollar) – 4,797 – 1,806 992 1,999
Cash inflow (Canadian dollar equivalent of U.S. dollar) – (4,302)* – (1,475)* (844)* (1,983)*
Net carrying amount of derivatives 460
$ 12,673 $ 12,744 $ 2,130 $ 2,056 $ 2,001 $ 6,557
December 31, 2010 Carrying
amount Contractual
cash flows Less than
1 year 1to3
years 4to5
years More than
5 years
Bank advances $ 45 $ 45 $ 45 $ – $ – $ –
Accounts payable and accrued liabilities 2,133 2,133 2,133 – – –
Income tax payable 238 238 238 – – –
Long-term debt 8,654 8,723 – 1,164 1,920 5,639
Other long-term liabilities 64 64 – 33 19 12
Debt Derivative instruments:
Cash outflow (Canadian dollar) – 5,907 – 1,570 2,338 1,999
Cash inflow (Canadian dollar equivalent of U.S. dollar) – (5,023)* – (1,164)* (1,920)* (1,939)*
Net carrying amount of derivatives 900
$ 12,034 $ 12,087 $ 2,416 $ 1,603 $ 2,357 $ 5,711
* Represents Canadian dollar equivalent amount of U.S. dollar inflows matched to an equal amount of U.S. dollar maturities in long-term debt
for Debt Derivatives.
In addition to the amounts noted above, at December 31, 2011 and
2010, net interest payments over the life of the long-term debt,
including the impact of the associated Debt Derivatives are:
December 31, 2011 Less than
1 year 1to3
years 4to5
years More than
5 years
Interest payments $ 663 $ 1,219 $ 920 $ 4,229
December 31, 2010 Less than
1 year 1to3
years 4to5
years More than
5 years
Interest payments $ 645 $ 1,158 $ 864 $ 3,548
(d) Market risk:
Market risk is the risk that changes in market prices, such as
fluctuations in the market prices of the Company’s publicly traded
investments, the Company’s share price, foreign exchange rates and
interest rates, will affect the Company’s income or the value of its
financial instruments.
(i) Publicly traded investments:
The Company manages its risk related to fluctuations in the
market prices of its publicly traded investments by regularly
conducting financial reviews of publicly available information
related to these investments to ensure that any risks are within
established levels of risk tolerance. The Company does not
routinely engage in risk management practices such as hedging,
derivatives or short selling with respect to its publicly traded
investments.
At December 31, 2011, a $1 change in the market price per share
of the Company’s publicly traded investments would have
resulted in a $14 million change in the Company’s other
comprehensive income, net of income taxes of $2 million.
(ii) Stock-based compensation:
In addition, market risk arises from accounting for the
Company’s stock-based compensation. All of the Company’s
outstanding stock options are classified as liabilities and are
carried at their fair value, as adjusted for vesting, determined
using the Company’s Class B Non-Voting share price, Black-
2011 ANNUAL REPORT ROGERS COMMUNICATIONS INC. 113