Rogers 2011 Annual Report Download - page 35
Download and view the complete annual report
Please find page 35 of the 2011 Rogers annual report below. You can navigate through the pages in the report by either clicking on the pages listed below, or by using the keyword search tool below to find specific information within the annual report.-
 1
1 -
2
-
3
-
4
-
5
-
6
-
7
-
8
-
9
-
10
-
11
-
12
-
13
-
14
-
15
-
16
-
17
-
18
-
19
-
20
-
21
-
22
-
23
-
24
-
 25
25 -
 26
26 -
 27
27 -
 28
28 -
 29
29 -
 30
30 -
 31
31 -
 32
32 -
 33
33 -
 34
34 -
 35
35 -
 36
36 -
 37
37 -
 38
38 -
 39
39 -
 40
40 -
 41
41 -
 42
42 -
 43
43 -
 44
44 -
 45
45 -
46
-
47
-
48
-
49
-
50
-
51
-
52
-
53
-
54
-
55
-
56
-
57
-
58
-
59
-
60
-
61
-
62
-
63
-
64
-
65
-
66
-
67
-
68
-
69
-
70
-
71
-
72
-
73
-
74
-
75
-
76
-
77
-
78
-
79
-
80
-
81
-
82
-
83
-
84
-
85
-
86
-
87
-
88
-
89
-
90
-
91
-
92
-
93
-
94
-
95
-
96
-
97
-
98
-
99
-
100
-
101
-
102
-
103
-
104
-
105
-
106
-
107
-
108
-
109
-
110
-
111
-
112
-
113
-
114
-
115
-
116
-
117
-
118
-
119
-
120
-
121
-
122
-
123
-
124
-
125
-
126
-
127
-
128
-
129
-
130
-
131
-
132
-
133
-
134
-
135
-
136
 |
 |

MANAGEMENT’S DISCUSSION AND ANALYSIS
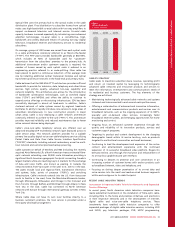
spending on advertising and promotion and data activations. These
increases were predominately offset by savings related to operating
and scale efficiencies across various functions.
Total retention spending, including subsidies on handset upgrades,
was flat year-over-year at $785 million in 2011, compared to
$788 million in 2010, as a result of lower volumes of smartphones
offset by a higher mix of smartphones, compared to 2010.
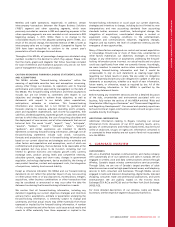
Wireless Adjusted Operating Profit
The 4% year-over-year decrease in adjusted operating profit and the
46.0% adjusted operating profit margin on network revenue (which
excludes equipment sales revenue) for 2011 primarily reflects the
increase in the total operating expenses, driven by the record high
volume of smartphone sales and activations as discussed above,
partially offset by the increase in network revenue.
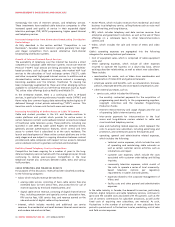
($)
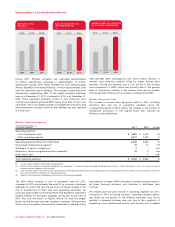
WIRELESS POSTPAID
MONTHLY ARPU
$73.93 $72.62 $70.26
2009 20102011
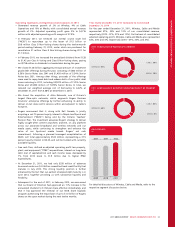
(%)
WIRELESS POSTPAID
MONTHLY CHURN
1.06%1.18% 1.32%
2009 20102011
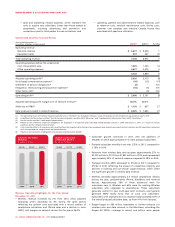
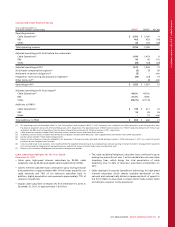
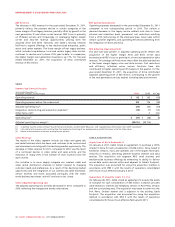
Wireless Additions to Property, Plant and Equipment
Wireless additions to PP&E are classified into the following categories:
Years ended December 31,
(In millions of dollars) 2011 2010 % Chg
Additions to PP&E
Capacity $628$ 446 41
Quality 250 284 (12)
Network – other 61 61 –
Information technology and other 253 146 73
Total additions to PP&E $ 1,192 $ 937 27
Wireless PP&E additions for 2011 reflect spending on network
capacity, such as radio channel additions, network core improvements
and network enhancing features, including the continued
deployment of our LTE and HSPA+ networks. Quality-related
additions to PP&E are associated with upgrades to the network to
enable higher throughput speeds, in addition to improved network
access associated activities such as site build programs and network
sectorization work. Moreover, Quality includes test and monitoring
equipment and operating support system activities. Investments in
Network – other are associated with network reliability and renewal
initiatives, infrastructure upgrades and new product platforms.
Information technology and other wireless specific system initiatives
include billing and back-office system upgrades, and other facilities
and equipment spending.
The increase in Wireless PP&E additions for 2011 is largely due to
investments to build out our LTE network across four of Canada’s top
markets with services now available in Ottawa, Toronto, Montreal
and Vancouver with expansion continuing into 2012. Information
technology investments on our customer billing systems and
platforms for new services contributed to the year-over-year increase
as well.
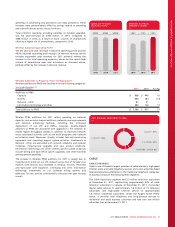
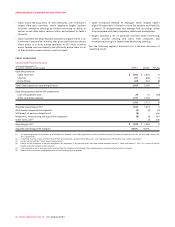
(%)
2011 WIRELESS ADDITIONS TO PP&E
CAPACITY 53%
QUALITY 21%
NETWORK - OTHER 5%
IT & OTHER 21%
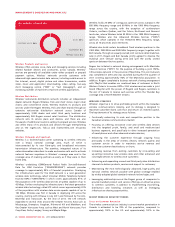
CABLE
CABLE’S BUSINESS
Cable is one of Canada’s largest providers of cable television, high-speed
Internet access and cable telephony services, and is also a facilities-based
telecommunications alternative to the traditional telephone companies.
Its business consists of the following three segments:
The Cable Operations segment had 2.3 million television subscribers
at December 31, 2011, representing approximately 32% of cable
television subscribers in Canada. At December 31, 2011, it provided
digital cable services to approximately 1.8 million of its television
subscribers and high-speed Internet service to approximately
1.8 million residential subscribers. Under the Rogers Home Phone
brand, it provides local telephone and long-distance services to
residential and small business customers and had over one million
subscriber lines at December 31, 2011.
2011 ANNUAL REPORT ROGERS COMMUNICATIONS INC. 31