Rogers 2011 Annual Report Download - page 118
Download and view the complete annual report
Please find page 118 of the 2011 Rogers annual report below. You can navigate through the pages in the report by either clicking on the pages listed below, or by using the keyword search tool below to find specific information within the annual report.-
 1
1 -
2
-
3
-
4
-
5
-
6
-
7
-
8
-
9
-
10
-
11
-
12
-
13
-
14
-
15
-
16
-
17
-
18
-
19
-
20
-
21
-
22
-
23
-
24
-
25
-
26
-
27
-
28
-
29
-
30
-
31
-
32
-
33
-
34
-
35
-
36
-
37
-
38
-
39
-
40
-
41
-
42
-
43
-
44
-
45
-
46
-
47
-
48
-
49
-
50
-
51
-
52
-
53
-
54
-
55
-
56
-
57
-
58
-
59
-
60
-
61
-
62
-
63
-
64
-
65
-
66
-
67
-
68
-
69
-
70
-
71
-
72
-
73
-
74
-
75
-
76
-
77
-
78
-
79
-
80
-
81
-
82
-
83
-
84
-
85
-
86
-
87
-
88
-
89
-
90
-
91
-
92
-
93
-
94
-
95
-
96
-
97
-
98
-
99
-
100
-
101
-
102
-
103
-
104
-
105
-
106
-
107
-
 108
108 -
 109
109 -
 110
110 -
 111
111 -
 112
112 -
 113
113 -
 114
114 -
 115
115 -
 116
116 -
 117
117 -
 118
118 -
 119
119 -
 120
120 -
 121
121 -
 122
122 -
 123
123 -
 124
124 -
 125
125 -
 126
126 -
 127
127 -
 128
128 -
129
-
130
-
131
-
132
-
133
-
134
-
135
-
136
 |
 |

NOTES TO CONSOLIDATED FINANCIAL STATEMENTS
Scholes and trinomial option pricing models. Both option pricing
models use the Company’s Class B Non-Voting share price during
the life of the option. All of the Company’s outstanding RSUs
and DSUs are classified as liabilities and are carried at their
intrinsic value, as adjusted for vesting, measured as the
difference between the current share price and the respective
RSU and DSU exercise price. The intrinsic value of the liability is
marked-to-market each period, and stock based compensation
expense is impacted by the change in the price of the Company’s
Class B Non-Voting shares during the life of the RSU and DSU.
At December 31, 2011, a $1 change in the market price of the
Company’s Class B Non-Voting shares would have resulted in a
change of $6 million in net income
(iii) Foreign exchange and interest rates:
The Company uses derivative financial instruments to manage its
risks from fluctuations in foreign exchange and interest rates
associated with its U.S. dollar denominated debt instruments.
The Company also uses derivative financial instruments to
manage the foreign exchange risk in its operations. The
Company does not use derivative instruments for speculative
purposes. From time to time, these derivative financial
instruments include cross-currency interest rate exchange
agreements, foreign exchange forward contracts and foreign
exchange option agreements. All such agreements are used for
risk management purposes only and are designated as a hedge
of specific debt instruments for economic purposes.
In July 2011, the Company entered into foreign exchange forward
contracts to manage foreign exchange risk on certain forecasted
expenditures. All of these Expenditure Derivatives were accounted for
as hedges during the year ended December 31, 2011, with changes in
fair value being recorded in the hedging reserve, a component of
equity. The Expenditure Derivatives fix the exchange rate on an
aggregate U.S. $20 million per month of the Company’s forecast
expenditures at an average exchange rate of Cdn$0.9643/U.S.$1
from August 2011 through July 2014. At December 31, 2011,
U.S. $620 million of these Expenditure Derivatives remain
outstanding.
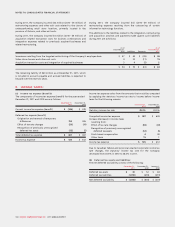
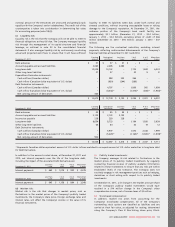
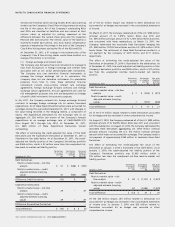
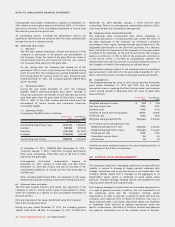
The effect of estimating the credit-adjusted fair value of the Debt
Derivatives and the Expenditure Derivatives at December 31, 2011 is
illustrated in the table below. As at December 31, 2011, the credit-
adjusted net liability position of the Company’s Derivatives portfolio
was $460 million, which is $2 million more than the unadjusted risk-
free mark-to-market net liability position.
December 31, 2011
Derivatives
in an asset
position
(A)
Derivatives
in a liability
position
(B)
Net asset
(liability)
position
(A) + (B)
Debt Derivatives:
Mark-to-market value – risk-free
analysis $ 51 $ (548) $ (497)
Mark-to-market value – credit-
adjusted estimate (carrying
value) 41 (540) (499)
Difference, Debt Derivatives (10) 8 (2)
Expenditure Derivatives:
Mark-to-market value – risk-free
analysis 39 – 39
Mark-to-market value – credit-
adjusted estimate (carrying
value) 39 – 39
Difference, Expenditure Derivatives – – –
Total Difference $ (10) $ 8 $ (2)
All of the $2 million impact was related to Debt Derivatives not
accounted for as hedges and recorded in the consolidated statements
of income.
On March 21, 2011, the Company redeemed all of the U.S. $350 million
principal amount of its 7.875% Senior Notes due 2012 and
U.S. $470 million principal amount of its 7.25% Senior Notes due 2012,
and concurrent with these redemptions, on March 21, 2011, the
Company terminated the associated Debt Derivatives hedging the
U.S. $350 million 7.875% Senior Notes and the U.S. $470 million 7.25%
Senior Notes. The settlement of these Debt Derivatives resulted in a
net payment by the Company of $219 million and $111 million,
respectively.
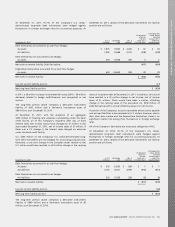
The effect of estimating the credit-adjusted fair value of the
Derivatives at December 31, 2010 is illustrated in the table below. As
at December 31, 2010, the credit-adjusted net liability position of the
Company’s derivatives portfolio was $900 million, which is $17 million
less than the unadjusted risk-free mark-to-market net liability
position.
December 31, 2010
Derivatives
in an asset
position
(A)
Derivatives
in a liability
position
(B)
Net asset
(liability)
position
(A) + (B)
Debt Derivatives:
Mark-to-market value – risk-free
analysis $ 7 $ (924) $ (917)
Mark-to-market value – credit-
adjusted estimate (carrying
value) 7 (907) (900)
Total Difference $ – $ 17 $ 17
All of the $17 million impact related to Debt Derivatives accounted
for as hedges and was recorded in other comprehensive income.
On August 27, 2010, the Company redeemed all of the U.S. $490 million
principal amount of its 9.625% Senior Notes due 2011 and, concurrent
with this redemption, on August 27, 2010, the Company terminated the
associated Debt Derivatives aggregating U.S. $500 million notional
principal amount, including the U.S. $10 million notional principal
amount which were not accounted for as hedges. The Company made a
net payment of approximately $269 million to terminate these Debt
Derivatives.
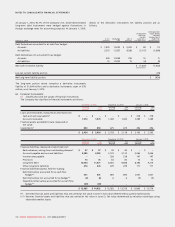
The effect of estimating the credit-adjusted fair value of the
Derivatives at January 1, 2010 is illustrated in the table below. As at
January 1, 2010, the credit-adjusted net liability position of the
Company’s Derivatives portfolio was $1,002 million, which is
$25 million less than the unadjusted risk-free mark-to-market net
liability position.
January 1, 2010
Derivatives
in an asset
position
(A)
Derivatives
in a liability
position
(B)
Net asset
(liability)
position
(A) + (B)
Debt Derivatives:
Mark-to-market value – risk-
free analysis $ 94 $ (1,121) $ (1,027)
Mark-to-market value – credit-
adjusted estimate (carrying
value) 82 (1,084) (1,002)
Total Difference $ (12) $ 37 $ 25
Of the $25 million impact, ($1) million related to Derivatives not
accounted for as hedges was recorded in the consolidated statements
of income prior to January 1, 2010 and $26 million related to
Derivatives accounted for as hedges was recorded in other
comprehensive income.
114 ROGERS COMMUNICATIONS INC. 2011 ANNUAL REPORT