Rogers 2011 Annual Report Download - page 120
Download and view the complete annual report
Please find page 120 of the 2011 Rogers annual report below. You can navigate through the pages in the report by either clicking on the pages listed below, or by using the keyword search tool below to find specific information within the annual report.-
 1
1 -
2
-
3
-
4
-
5
-
6
-
7
-
8
-
9
-
10
-
11
-
12
-
13
-
14
-
15
-
16
-
17
-
18
-
19
-
20
-
21
-
22
-
23
-
24
-
25
-
26
-
27
-
28
-
29
-
30
-
31
-
32
-
33
-
34
-
35
-
36
-
37
-
38
-
39
-
40
-
41
-
42
-
43
-
44
-
45
-
46
-
47
-
48
-
49
-
50
-
51
-
52
-
53
-
54
-
55
-
56
-
57
-
58
-
59
-
60
-
61
-
62
-
63
-
64
-
65
-
66
-
67
-
68
-
69
-
70
-
71
-
72
-
73
-
74
-
75
-
76
-
77
-
78
-
79
-
80
-
81
-
82
-
83
-
84
-
85
-
86
-
87
-
88
-
89
-
90
-
91
-
92
-
93
-
94
-
95
-
96
-
97
-
98
-
99
-
100
-
101
-
102
-
103
-
104
-
105
-
106
-
107
-
108
-
109
-
 110
110 -
 111
111 -
 112
112 -
 113
113 -
 114
114 -
 115
115 -
 116
116 -
 117
117 -
 118
118 -
 119
119 -
 120
120 -
 121
121 -
 122
122 -
 123
123 -
 124
124 -
 125
125 -
 126
126 -
 127
127 -
 128
128 -
 129
129 -
 130
130 -
131
-
132
-
133
-
134
-
135
-
136
 |
 |

NOTES TO CONSOLIDATED FINANCIAL STATEMENTS
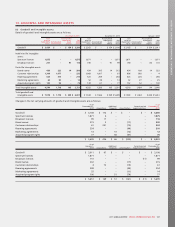
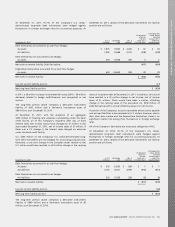
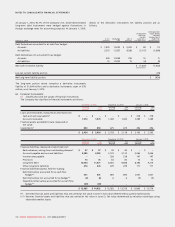
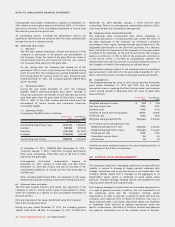
At January 1, 2010, 93.7% of the Company’s U.S. dollar-denominated
long-term debt instruments were hedged against fluctuations in
foreign exchange rates for accounting purposes. At January 1, 2010,
details of the derivative instruments net liability position are as
follows:
January 1, 2010 U.S. $
notional Exchange
rate Cdn. $
notional
Unadjusted
mark-to-
market
value on a
risk-free basis
Estimated fair
value, being
carrying
amount on a
credit risk
adjusted basis
Debt Derivatives accounted for as cash flow hedges:
As assets $ 1,975 1.0252 $ 2,025 $ 84 $ 73
As liabilities 3,215 1.3337 4,288 (1,117) (1,080)
Debt Derivatives not accounted for as hedges:
As assets 350 1.0258 359 10 9
As liabilities 10 1.5370 15 (4) (4)
Net mark-to-market liability $ (1,027) (1,002)
Less net current liability portion (76)
Net long-term liability portion $ (926)
The long-term portion above comprises a derivative instruments
liability of $1,004 million and a derivative instruments asset of $78
million, as at January 1, 2010.
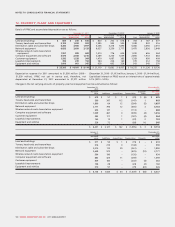
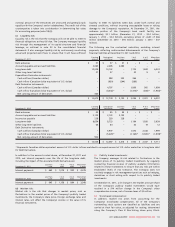
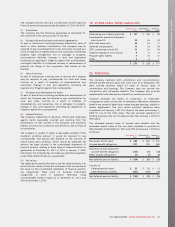
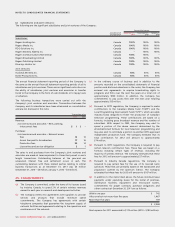
(e) Financial instruments:
(i) Classification and fair values of financial instruments:
The Company has classified its financial instruments as follows:
December 31, 2011 December 31, 2010 January 1, 2010
Carrying
amount Fair
value Carrying
amount Fair
value Carrying
amount Fair
value
Loans and receivables, measured at amortized cost:
Cash and cash equivalents* $–$–$ – $ – $ 378 $ 378
Accounts receivable 1,574 1,574 1,443 1,443 1,289 1,289
Financial assets, available-for-sale, measured at
fair value:
Investments* 850 850 675 675 496 496
$ 2,424 $ 2,424 $ 2,118 $ 2,118 $ 2,163 $ 2,163
December 31, 2011 December 31, 2010 January 1, 2010
Carrying
amount Fair
value Carrying
amount Fair
value Carrying
amount Fair
value
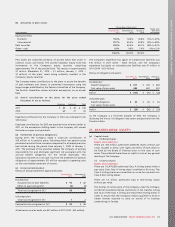
Financial liabilities, measured at amortized cost:
Bank advances, arising from outstanding cheques* $57$57$45$45$–$–
Accounts payable and accrued liabilities 2,085 2,0852,133 2,133 2,066 2,066
Income taxes payable ––238 238 147 147
Provisions 73 73 83 83 72 72
Long-term debt 10,034 11,471 8,654 9,688 8,396 9,315
Other long-term liabilities 276 276 229 229 177 177
Financial liabilities (assets), held-for-trading:
Debt Derivatives accounted for as cash flow
hedges** 501 501 894 894 1,007 1,007
Debt Derivatives not accounted for as hedges** (2) (2) 6 6 (5) (5)
Expenditure Derivatives accounted for as cash flow
hedges** (39) (39) ––––
$ 12,985 $ 14,422 $ 12,282 $ 13,316 $ 11,860 $ 12,779
(*) Denotes financial assets and liabilities that are carried at fair value in Level 1; fair value determined by quoted market prices
(**) Denotes financial assets and liabilities that are carried at fair value in Level 2; fair value determined by valuation technique using
observable market inputs
116 ROGERS COMMUNICATIONS INC. 2011 ANNUAL REPORT