Rogers 2011 Annual Report Download - page 49
Download and view the complete annual report
Please find page 49 of the 2011 Rogers annual report below. You can navigate through the pages in the report by either clicking on the pages listed below, or by using the keyword search tool below to find specific information within the annual report.-
 1
1 -
2
-
3
-
4
-
5
-
6
-
7
-
8
-
9
-
10
-
11
-
12
-
13
-
14
-
15
-
16
-
17
-
18
-
19
-
20
-
21
-
22
-
23
-
24
-
25
-
26
-
27
-
28
-
29
-
30
-
31
-
32
-
33
-
34
-
35
-
36
-
37
-
38
-
 39
39 -
 40
40 -
 41
41 -
 42
42 -
 43
43 -
 44
44 -
 45
45 -
 46
46 -
 47
47 -
 48
48 -
 49
49 -
 50
50 -
 51
51 -
 52
52 -
 53
53 -
 54
54 -
 55
55 -
 56
56 -
 57
57 -
 58
58 -
 59
59 -
60
-
61
-
62
-
63
-
64
-
65
-
66
-
67
-
68
-
69
-
70
-
71
-
72
-
73
-
74
-
75
-
76
-
77
-
78
-
79
-
80
-
81
-
82
-
83
-
84
-
85
-
86
-
87
-
88
-
89
-
90
-
91
-
92
-
93
-
94
-
95
-
96
-
97
-
98
-
99
-
100
-
101
-
102
-
103
-
104
-
105
-
106
-
107
-
108
-
109
-
110
-
111
-
112
-
113
-
114
-
115
-
116
-
117
-
118
-
119
-
120
-
121
-
122
-
123
-
124
-
125
-
126
-
127
-
128
-
129
-
130
-
131
-
132
-
133
-
134
-
135
-
136
 |
 |

MANAGEMENT’S DISCUSSION AND ANALYSIS
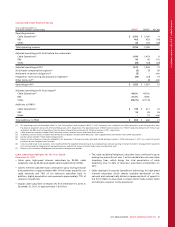
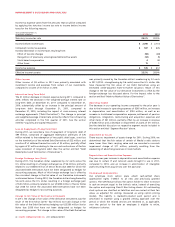
RECONCILIATION OF NET INCOME TO OPERATING
PROFIT AND ADJUSTED OPERATING PROFIT FOR
THE PERIOD
The items listed below represent the consolidated income and
expense amounts that are required to reconcile net income as defined
under IFRS to the non-GAAP measures operating profit and adjusted
operating profit for the year. See the section entitled “Supplementary
Information: Non-GAAP Calculations” for a full reconciliation to
adjusted operating profit, adjusted net income and adjusted earnings
per share. For details of these amounts on a segment-by-segment
basis and for an understanding of intersegment eliminations on
consolidation, the following section should be read in conjunction
with Note 4 to the 2011 Audited Consolidated Financial Statements
entitled “Segmented Information”.
Years ended December 31,
(In millions of dollars) 2011 2010 % Chg
Net income $ 1,563 $ 1,502 4
Income tax expense 535 612 (13)
Other income(1) (8)(1) n/m
Finance costs:
Interest on long-term debt 668669 –
Loss on repayment of long-term debt 99 87 14
Foreign exchange loss (gain) 6(20) n/m
Change in fair value of derivative instruments (14) 22 n/m
Capitalized interest (29) (3) n/m
Amortization of deferred transaction costs 813 (38)
Operating income 2,8282,881 (2)
Impairment of assets –11 n/m
Depreciation and amortization 1,743 1,639 6
Operating profit 4,571 4,531 1
Stock-based compensation expense 64 50 28
Settlement of pension obligations 11 – n/m
Integration, restructuring and acquisition expenses 70 40 75
Other items, net –14 n/m
Adjusted operating profit $ 4,716 $ 4,635 2
(1) Other income includes share of the income in associates and joint ventures accounted for using the equity method, net of tax.
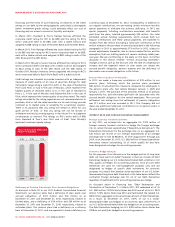
Net Income
The $61 million increase in net income compared to the prior year is
primarily due to the growth in adjusted operating profit of $81
million and a $77 million decline in income tax expenses, partially
offset by an increase in foreign exchange loss of $26 million and an
increase in loss on repayment of long-term debt of $12 million.
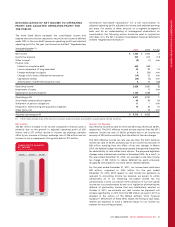
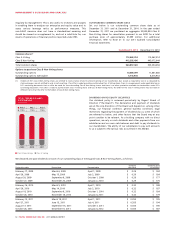
(In millions of dollars)
CONSOLIDATED ADJUSTED
NET INCOME
$1,556$1,678 $1,747
2009 20102011
Income Tax Expense
Our effective income tax rate for 2011 and 2010 was 25.5% and 28.9%,
respectively. The 2011 effective income tax rate was less than the 2011
statutory income tax rate of 28.0% primarily due to an income tax
recovery of $59 million resulting from the effect of tax rate changes.
The 2010 effective income tax rate was less than the 2010 statutory
income tax rate of 30.5% primarily due to an income tax recovery of
$69 million resulting from the effect of tax rate changes. In March
2010, the federal budget introduced proposed changes that impact the
tax deductibility of cash-settled stock options. The proposed legislative
changes were substantively enacted in December 2010. As a result, in
the year ended December 31, 2010, we recorded a one-time income
tax charge of $40 million to reduce deferred tax assets previously
recognized with respect to our stock option related liabilities.
For the year ended December 31, 2011, our income taxes paid were
$99 million, compared to $152 million for the year ended
December 31, 2010. With respect to cash income tax payments as
opposed to accounting income tax expense, we expect to utilize
substantially all of our remaining non-capital income tax loss
carryforwards in 2012. As a result of the utilization of our non-capital
income tax loss carryforwards as well as of legislation eliminating the
deferral of partnership income that was substantially enacted on
October 4, 2011, we estimate our cash income tax payments will
increase significantly in 2012 from the $99 million we paid in 2011 as
detailed in the section of this MD&A entitled “2012 Financial
Guidance”. While both of these items impact the timing of cash taxes,
neither are expected to have a material impact to our income tax
expense for accounting purposes.
2011 ANNUAL REPORT ROGERS COMMUNICATIONS INC. 45