National Grid 2014 Annual Report Download - page 99
Download and view the complete annual report
Please find page 99 of the 2014 National Grid annual report below. You can navigate through the pages in the report by either clicking on the pages listed below, or by using the keyword search tool below to find specific information within the annual report.-
 1
1 -
2
-
3
-
4
-
5
-
6
-
7
-
8
-
9
-
10
-
11
-
12
-
13
-
14
-
15
-
16
-
17
-
18
-
19
-
20
-
21
-
22
-
23
-
24
-
25
-
26
-
27
-
28
-
29
-
30
-
31
-
32
-
33
-
34
-
35
-
36
-
37
-
38
-
39
-
40
-
41
-
42
-
43
-
44
-
45
-
46
-
47
-
48
-
49
-
50
-
51
-
52
-
53
-
54
-
55
-
56
-
57
-
58
-
59
-
60
-
61
-
62
-
63
-
64
-
65
-
66
-
67
-
68
-
69
-
70
-
71
-
72
-
73
-
74
-
75
-
76
-
77
-
78
-
79
-
80
-
81
-
82
-
83
-
84
-
85
-
86
-
87
-
88
-
 89
89 -
 90
90 -
 91
91 -
 92
92 -
 93
93 -
 94
94 -
 95
95 -
 96
96 -
 97
97 -
 98
98 -
 99
99 -
 100
100 -
 101
101 -
 102
102 -
 103
103 -
 104
104 -
 105
105 -
 106
106 -
 107
107 -
 108
108 -
 109
109 -
110
-
111
-
112
-
113
-
114
-
115
-
116
-
117
-
118
-
119
-
120
-
121
-
122
-
123
-
124
-
125
-
126
-
127
-
128
-
129
-
130
-
131
-
132
-
133
-
134
-
135
-
136
-
137
-
138
-
139
-
140
-
141
-
142
-
143
-
144
-
145
-
146
-
147
-
148
-
149
-
150
-
151
-
152
-
153
-
154
-
155
-
156
-
157
-
158
-
159
-
160
-
161
-
162
-
163
-
164
-
165
-
166
-
167
-
168
-
169
-
170
-
171
-
172
-
173
-
174
-
175
-
176
-
177
-
178
-
179
-
180
-
181
-
182
-
183
-
184
-
185
-
186
-
187
-
188
-
189
-
190
-
191
-
192
-
193
-
194
-
195
-
196
 |
 |

Strategic Report Corporate Governance Financial Statements Additional Information
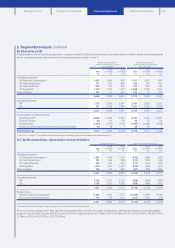
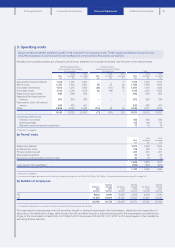
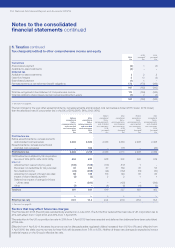
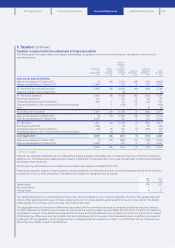
3. Operating costs
Below we have presented separately certain items included in our operating costs. These include a breakdown of payroll costs
(including disclosure of amounts paid to key management personnel) and fees paid to our auditors.
Rentals under operating leases are charged to the income statement on a straight-line basis over the term of the relevant lease.
Before exceptional items,
remeasurements and stranded
cost recoveries
Exceptional items,
remeasurements and stranded
cost recoveries Total
2014
£m
2013
(restated)1
£m
2012
(restated)1
£m
2014
£m
2013
(restated)1
£m
2012
(restated)1
£m
2014
£m
2013
(restated)1
£m
2012
(restated)1
£m
Depreciation and amortisation 1,416 1,361 1,267 –– 5 1,416 1,361 1,272
Payroll costs 1,373 1,434 1,381 59 22 82 1,432 1,456 1,463
Purchases of electricity 1,513 1,251 1,356 (49) (111) 89 1,464 1,140 1,445
Purchases of gas 1,722 1,384 1,518 33 (69) 51,755 1,315 1,523
Rates and property taxes 963 969 955 –– – 963 969 955
Balancing Services Incentive
Scheme 872 805 818 –– – 872 805 818
Payments to other UK network
owners 630 487 407 –– – 630 487 407
Other 2,656 3,029 2,360 (114) 48 54 2,542 3,077 2,414
11,145 10,720 10,062 (71) (110 ) 235 11,074 10,610 10,297
Operating costs include:
Inventory consumed 422 389 360
Operating leases 115 109 97
Research and development expenditure 12 15 15
1. See note 1 on page 92.
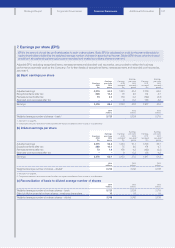
(a) Payroll costs
2014
£m
2013
(restated)1
£m
2012
(restated)1
£m
Wages and salaries21,575 1,596 1,566
Social security costs 126 120 116
Pension costs (note 22) 245 231 231
Share-based payment 20 20 24
Severance costs (excluding pension costs) 30 16 35
1,996 1,983 1,972
Less: payroll costs capitalised (564) (527) (509)
1,432 1,456 1,463
1. See note 1 on page 92.
2. Included within wages and salaries are US other post-retirement benefit costs of £44m (2013: £43m; 2012: £60m). For further information refer to note 22 on page 122.
(b) Number of employees
31 March
2014
Number
Monthly
average
2014
Number
31 March
2013
Number1
Monthly
average
2013
Number1
31 March
2012
Number1
Monthly
average
2012
Number1
UK 9,693 9,641 9,990 9,816 9,696 9,769
US 14,216 15,094 15,438 15,555 15,843 16,080
23,909 24,735 25,428 25,371 25,539 25,849
1. Comparatives have been re-presented on a basis consistent with the current year classification.
The vast majority of employees in the US are either directly or indirectly employed in the transmission, distribution and generation of
electricity or the distribution of gas, while those in the UK are either directly or indirectly employed in the transmission and distribution
ofgas or the transmission of electricity. At 31 March 2014, there were 2,044 (2013: 2,151; 2012: 2,357) employees in other operations,
excluding sharedservices.
97