National Grid 2014 Annual Report Download - page 96
Download and view the complete annual report
Please find page 96 of the 2014 National Grid annual report below. You can navigate through the pages in the report by either clicking on the pages listed below, or by using the keyword search tool below to find specific information within the annual report.-
 1
1 -
2
-
3
-
4
-
5
-
6
-
7
-
8
-
9
-
10
-
11
-
12
-
13
-
14
-
15
-
16
-
17
-
18
-
19
-
20
-
21
-
22
-
23
-
24
-
25
-
26
-
27
-
28
-
29
-
30
-
31
-
32
-
33
-
34
-
35
-
36
-
37
-
38
-
39
-
40
-
41
-
42
-
43
-
44
-
45
-
46
-
47
-
48
-
49
-
50
-
51
-
52
-
53
-
54
-
55
-
56
-
57
-
58
-
59
-
60
-
61
-
62
-
63
-
64
-
65
-
66
-
67
-
68
-
69
-
70
-
71
-
72
-
73
-
74
-
75
-
76
-
77
-
78
-
79
-
80
-
81
-
82
-
83
-
84
-
85
-
 86
86 -
 87
87 -
 88
88 -
 89
89 -
 90
90 -
 91
91 -
 92
92 -
 93
93 -
 94
94 -
 95
95 -
 96
96 -
 97
97 -
 98
98 -
 99
99 -
 100
100 -
 101
101 -
 102
102 -
 103
103 -
 104
104 -
 105
105 -
 106
106 -
107
-
108
-
109
-
110
-
111
-
112
-
113
-
114
-
115
-
116
-
117
-
118
-
119
-
120
-
121
-
122
-
123
-
124
-
125
-
126
-
127
-
128
-
129
-
130
-
131
-
132
-
133
-
134
-
135
-
136
-
137
-
138
-
139
-
140
-
141
-
142
-
143
-
144
-
145
-
146
-
147
-
148
-
149
-
150
-
151
-
152
-
153
-
154
-
155
-
156
-
157
-
158
-
159
-
160
-
161
-
162
-
163
-
164
-
165
-
166
-
167
-
168
-
169
-
170
-
171
-
172
-
173
-
174
-
175
-
176
-
177
-
178
-
179
-
180
-
181
-
182
-
183
-
184
-
185
-
186
-
187
-
188
-
189
-
190
-
191
-
192
-
193
-
194
-
195
-
196
 |
 |

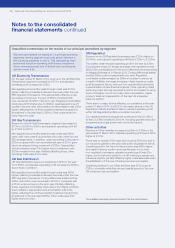
Notes to the consolidated
financial statements continued
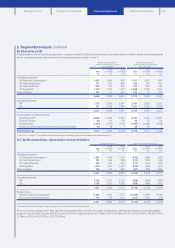
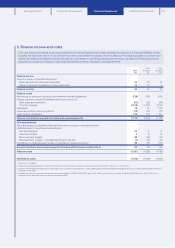
2. Segmental analysis continued
The following table describes the main activities for each operating segment:
UK Electricity Transmission High voltage electricity transmission networks in Great Britain.
UK Gas Transmission The gas transmission network in Great Britain and UK LNG storageactivities.
UK Gas Distribution Four of the eight regional networks of Great Britain’s gas distribution system.
US Regulated Gas distribution networks, electricity distribution networks and high voltage electricity
transmission networks in New York and New England (including EnergyNorth and
Granite State up to the date they were sold on 3 July 2012) and electricity generation
facilities in New York and Massachusetts.
Other activities primarily relate to non-regulated businesses and other commercial operations not included within the above segments,
including: the Great Britain-France electricity interconnector; UK-based gas metering activities; UK property management; a UK LNG
import terminal; US LNG operations; US unregulated transmission pipelines; together with corporate activities.
Sales between operating segments are priced considering the regulatory and legal requirements to which the businesses are subject.
The analysis of revenue by geographical area is on the basis of destination. There are no material sales between the UK and US
geographical areas.
(a) Revenue
2014 2013 2012
Total
sales
£m
Sales
between
segments
£m
Sales
to third
parties
£m
Total
sales
(restated)1
£m
Sales
between
segments
(restated)1
£m
Sales
to third
parties
(restated)1
£m
Total
sales
(restated)1
£m
Sales
between
segments
(restated)1
£m
Sales
to third
parties
(restated)1
£m
Operating segments
UK Electricity Transmission 3,387 (14) 3,373 3,110 (15) 3,095 2,811 (16) 2,795
UK Gas Transmission 941 (104) 837 1,118 (89) 1,029 983 (8) 975
UK Gas Distribution 1,898 (49) 1,849 1,714 (47) 1,667 1,605 (52) 1,553
US Regulated 8,040 –8,040 7, 918 –7, 918 7,7 9 5 – 7,7 9 5
Other activities 736 (26) 710 678 (28) 650 74 4 (30) 714
15,002 (193) 14,809 14,538 (179) 14,359 13,938 (106) 13,832
Total excluding stranded cost
recoveries 14,809 14,359 13,553
Stranded cost recoveries ––279
14,809 14,359 13,832
Geographical areas
UK 6,759 6,421 6,000
US 8,050 7,938 7, 8 3 2
14,809 14,359 13,832
1. Restated to reflect the changes in operating segment presentation as described on page 93.
94 National Grid Annual Report and Accounts 2013/14