National Grid 2014 Annual Report Download - page 149
Download and view the complete annual report
Please find page 149 of the 2014 National Grid annual report below. You can navigate through the pages in the report by either clicking on the pages listed below, or by using the keyword search tool below to find specific information within the annual report.
Strategic Report Corporate Governance Financial Statements Additional Information
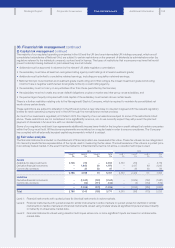
33. Sensitivities on areas of estimation and uncertainty
In order to give a clearer picture of the impact on our results or financial position of potential changes in significant estimates and
assumptions, the following sensitivities are presented. These sensitivities are hypothetical, as they are based on assumptions and
conditions prevailing at the year end, and should be used with caution. The effects provided are not necessarily indicative of the
actual effects that would be experienced because our actual exposures are constantly changing.
The sensitivities in the table below show the potential impact in the income statement (and consequential impact on net assets) for
arange of different variables which each have been considered in isolation (ie with all other variables remaining constant). There are a
number of these sensitivities which are mutually exclusive and therefore if one were to happen, another would not, meaning a total
showing how sensitive our results are to these external factors is not meaningful.
We are further required to show additional sensitivity analysis for changes in interest and exchange rates and these are shown separately
in the table below due to the additional assumptions that are made in order to produce meaningful sensitivity disclosures.
The sensitivities included in the table below all have an equal and opposite effect if the sensitivity increases or decreases by the same
amount unless otherwise stated. For example a 10% increase in unbilled revenue at 31 March 2014 would result in a decrease in the
income statement of £58m and a 10% decrease in unbilled revenue would have the equal but opposite effect.
2014 2013
Income
statement
£m
Net
assets
£m
Income
statement
£m
Net
assets
£m
One year average change in economic useful lives (pre-tax)
Depreciation charge on property, plant and equipment 68 68 68 68
Amortisation charge on intangible assets 18 18 15 15
Estimated future cash flows in respect of provisions change of 10% (pre-tax) 164 164 176 176
Assets and liabilities carried at fair value change of 10% (pre-tax)
Derivative financial instruments181 81 56 56
Commodity contract liabilities 4 4 5 5
Pensions and other post-retirement benefits2 (pre-tax)
UK discount rate change of 0.5%313 1,347 12 1,460
US discount rate change of 0.5%315 473 12 568
UK RPI rate change of 0.5%412 1,217 12 1,185
UK long-term rate of increase in salaries change of 0.5%5595 5 128
US long-term rate of increase in salaries change of 0.5%5439 543
UK change of one year to life expectancy at age 65 3548 3597
US change of one year to life expectancy at age 65 12 220 11 197
Assumed US healthcare cost trend rates change of 1% 28 355 29 416
Unbilled revenue at 31 March change of 10% (post-tax) 58 58 77 77
No hedge accounting for our derivative financial instruments (post-tax) 350 (294) (184) 106
Commodity risk6 (post-tax)
Commodity prices +10% 50 50 45 45
Commodity prices –10% (33) (33) (34) (34)
Financial risk7 (post-tax)
UK RPI rate change of 0.5%826 –25 –
UK interest rates change of 0.5% 93 68 98 90
US interest rates change of 0.5% 70 13 87 16
US dollar exchange rate change of 10% 55 641 65 600
1. The effect of a 10% change in fair value assumes no hedge accounting.
2. The changes shown are a change in the annual pension or other post-retirement benefit costs and change in the defined benefits obligations.
3. A change in the discount rate is likely to occur as a result of changes in bond yields and as such would be expected to be offset to a significant degree by a change in the value of the bond
assets heldby the plans.
4. The projected impact resulting from a change in RPI reflects the underlying effect on pensions in payment, pensions in deferment and resultant increases in salary assumptions.
5. This change has been applied to both the pre 1 April 2013 and post 1 April 2013 rate of increase in salary assumption.
6. Represents potential impact on fair values of commodity contracts only.
7. The impact on net assets does not reflect the exchange translation in our US subsidiary net assets. It is estimated this would change by £781m (2013: £712m) in the opposite direction if the
dollar exchange rate changed by 10%.
8. Excludes sensitivities to LPI index. Further details on sensitivities are provided in note 30 (g) on page 143.
With the adoption of IAS 19 (revised), we have reviewed the pension assumptions that we consider key (as shown on page 136), and as
aresult have changed the sensitivities presented in the table above.
147


