National Grid 2014 Annual Report Download - page 97
Download and view the complete annual report
Please find page 97 of the 2014 National Grid annual report below. You can navigate through the pages in the report by either clicking on the pages listed below, or by using the keyword search tool below to find specific information within the annual report.-
 1
1 -
2
-
3
-
4
-
5
-
6
-
7
-
8
-
9
-
10
-
11
-
12
-
13
-
14
-
15
-
16
-
17
-
18
-
19
-
20
-
21
-
22
-
23
-
24
-
25
-
26
-
27
-
28
-
29
-
30
-
31
-
32
-
33
-
34
-
35
-
36
-
37
-
38
-
39
-
40
-
41
-
42
-
43
-
44
-
45
-
46
-
47
-
48
-
49
-
50
-
51
-
52
-
53
-
54
-
55
-
56
-
57
-
58
-
59
-
60
-
61
-
62
-
63
-
64
-
65
-
66
-
67
-
68
-
69
-
70
-
71
-
72
-
73
-
74
-
75
-
76
-
77
-
78
-
79
-
80
-
81
-
82
-
83
-
84
-
85
-
86
-
 87
87 -
 88
88 -
 89
89 -
 90
90 -
 91
91 -
 92
92 -
 93
93 -
 94
94 -
 95
95 -
 96
96 -
 97
97 -
 98
98 -
 99
99 -
 100
100 -
 101
101 -
 102
102 -
 103
103 -
 104
104 -
 105
105 -
 106
106 -
 107
107 -
108
-
109
-
110
-
111
-
112
-
113
-
114
-
115
-
116
-
117
-
118
-
119
-
120
-
121
-
122
-
123
-
124
-
125
-
126
-
127
-
128
-
129
-
130
-
131
-
132
-
133
-
134
-
135
-
136
-
137
-
138
-
139
-
140
-
141
-
142
-
143
-
144
-
145
-
146
-
147
-
148
-
149
-
150
-
151
-
152
-
153
-
154
-
155
-
156
-
157
-
158
-
159
-
160
-
161
-
162
-
163
-
164
-
165
-
166
-
167
-
168
-
169
-
170
-
171
-
172
-
173
-
174
-
175
-
176
-
177
-
178
-
179
-
180
-
181
-
182
-
183
-
184
-
185
-
186
-
187
-
188
-
189
-
190
-
191
-
192
-
193
-
194
-
195
-
196
 |
 |

Strategic Report Corporate Governance Financial Statements Additional Information
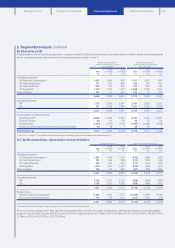
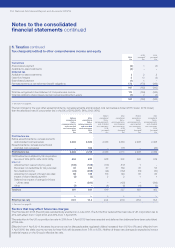
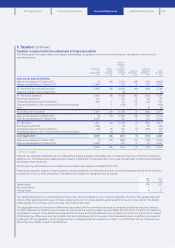
2. Segmental analysis continued
(b) Operating profit
A reconciliation of the operating segments’ measure of profit to total profit before tax is provided below. Further details of the exceptional
items, remeasurements and stranded cost recoveries are provided in note 4.
Before exceptional items,
remeasurements and stranded
cost recoveries
After exceptional items,
remeasurements and stranded
cost recoveries
2014
£m
2013
(restated)1
£m
2012
(restated)1
£m
2014
£m
2013
(restated)1
£m
2012
(restated)1
£m
Operating segments
UK Electricity Transmission 1,087 1,049 876 1,027 1,020 876
UK Gas Transmission 417 531 453 406 517 453
UK Gas Distribution 904 794 763 780 763 739
US Regulated 1,125 1,254 1,192 1,388 1,438 1,156
Other activities 131 11 207 134 11 311
3,664 3,639 3,491 3,735 3,74 9 3,535
Geographical areas
UK 2,723 2,530 2,347 2,531 2,456 2,351
US 941 1,109 1,144 1,204 1,293 1,184
3,664 3,639 3,491 3,735 3,74 9 3,535
Reconciliation to profit before tax
Operating profit 3,664 3,639 3,491 3,735 3,74 9 3,535
Finance income 36 30 28 36 30 28
Finance costs (1,144) (1,154) (1,118) (1,051) (1,086) (1,188)
Share of post-tax results of joint ventures and associates 28 18 728 18 7
Profit before tax 2,584 2,533 2,408 2,748 2,711 2,382
1. See note 1 on page 92. Also restated to reflect the changes in operating segment presentation as described on page 93.
(c) Capital expenditure, depreciation and amortisation
Capital expenditure Depreciation and amortisation
2014
£m
2013
(restated)1
£m
2012
(restated)1
£m
2014
£m
2013
(restated)1
£m
2012
(restated)1
£m
Operating segments
UK Electricity Transmission 1,381 1,430 1,153 (343) (323) (281)
UK Gas Transmission 181 249 235 (172) (162) (146)
UK Gas Distribution 480 666 645 (271) (261) (251)
US Regulated 1,219 1,124 1,052 (419) (430) (411)
Other activities 180 217 290 (211) (185) (183)
3,441 3,686 3,375 (1,416) (1,361) (1,272)
Geographical areas
UK 2,155 2,471 2,217 (938) (902) (849)
US 1,286 1,215 1,158 (478) (459) (423)
3,441 3,686 3,375 (1,416) (1,361) (1,272)
By asset type
Property, plant and equipment 3,262 3,511 3,172 (1,289) (1,260) (1,193)
Non-current intangible assets 179 175 203 (127) (101) (79)
3,441 3,686 3,375 (1,416) (1,361) (1,272)
1. Restated to reflect the changes in operating segment presentation as described on page 93.
Total non-current assets other than derivative financial assets, financial and other investments, deferred tax assets and pension assets
located in the UK and US were £24,531m and £18,349m respectively as at 31 March 2014 (31 March 2013: UK £23,344m, US £19,340m;
31 March 2012: UK £21,793m, US £17,666m).
95