National Grid 2014 Annual Report Download - page 3
Download and view the complete annual report
Please find page 3 of the 2014 National Grid annual report below. You can navigate through the pages in the report by either clicking on the pages listed below, or by using the keyword search tool below to find specific information within the annual report.-
 1
1 -
 2
2 -
 3
3 -
 4
4 -
 5
5 -
 6
6 -
 7
7 -
 8
8 -
 9
9 -
 10
10 -
 11
11 -
 12
12 -
 13
13 -
 14
14 -
15
-
16
-
17
-
18
-
19
-
20
-
21
-
22
-
23
-
24
-
25
-
26
-
27
-
28
-
29
-
30
-
31
-
32
-
33
-
34
-
35
-
36
-
37
-
38
-
39
-
40
-
41
-
42
-
43
-
44
-
45
-
46
-
47
-
48
-
49
-
50
-
51
-
52
-
53
-
54
-
55
-
56
-
57
-
58
-
59
-
60
-
61
-
62
-
63
-
64
-
65
-
66
-
67
-
68
-
69
-
70
-
71
-
72
-
73
-
74
-
75
-
76
-
77
-
78
-
79
-
80
-
81
-
82
-
83
-
84
-
85
-
86
-
87
-
88
-
89
-
90
-
91
-
92
-
93
-
94
-
95
-
96
-
97
-
98
-
99
-
100
-
101
-
102
-
103
-
104
-
105
-
106
-
107
-
108
-
109
-
110
-
111
-
112
-
113
-
114
-
115
-
116
-
117
-
118
-
119
-
120
-
121
-
122
-
123
-
124
-
125
-
126
-
127
-
128
-
129
-
130
-
131
-
132
-
133
-
134
-
135
-
136
-
137
-
138
-
139
-
140
-
141
-
142
-
143
-
144
-
145
-
146
-
147
-
148
-
149
-
150
-
151
-
152
-
153
-
154
-
155
-
156
-
157
-
158
-
159
-
160
-
161
-
162
-
163
-
164
-
165
-
166
-
167
-
168
-
169
-
170
-
171
-
172
-
173
-
174
-
175
-
176
-
177
-
178
-
179
-
180
-
181
-
182
-
183
-
184
-
185
-
186
-
187
-
188
-
189
-
190
-
191
-
192
-
193
-
194
-
195
-
196
 |
 |

Additional InformationCorporate Governance Financial StatementsStrategic Report
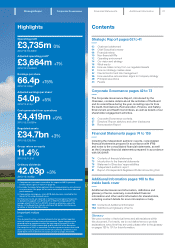
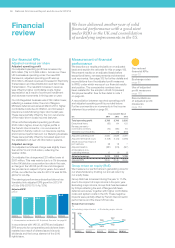
Highlights
Operating profit
£3,735m 0%
2012/13: £3,749m1
Adjusted operating profit2
£3,664m +1%
2012/13: £3,639m1
Earnings per share
66.4p +15%
2012/13: 57.8p1,3
Adjusted earnings per share2
54.0p +5%
2012/13: 51.4p1,3
Cash generated from operations
£4,419m +9%
2012/13: £4,037m
Regulated assets
£34.7bn +3%
2012/13: £33.7bn
Group return on equity
11. 4%
2012/13: 11.2%1
Ordinary dividends
42.03p +3%
2012/13: 40.85p
1. Comparatives have been restated for the impact of IAS 19 (revised).
Furtherdetail is given in note 1 on page 92.
2. Excludes the impact of exceptional items, remeasurements andstranded
costrecoveries. See page 182 for more information about these adjusted
profitmeasures.
3. Comparative earnings per share (EPS) data has been restated for the
impact ofthe scrip dividend issues.
Our financial results are reported in sterling. The average exchange rate,
as detailed on page 85, was $1.62 to £1 in 2013/14 compared with the
average rate of $1.57 to £1 in 2012/13. Except as otherwise noted, the
figures in this Report are stated in sterling or US dollars. All references
to dollars or $ are to the US currency.
Important notice
This document contains certain statements that are neither reported
financial results nor other historical information. These statements are
forward-looking statements within the meaning of Section 27A of the
Securities Act of 1933, as amended, and Section 21E of the Securities
Exchange Act of 1934, as amended. For a description of factors that could
affect future results, please refer to the full cautionary statement on the
inside back cover and to the risk factors section on pages 167 to 169.
Contents
Strategic Report pages 02 to 41
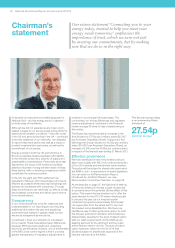
02 Chairman’s statement
04 Chief Executive’s review
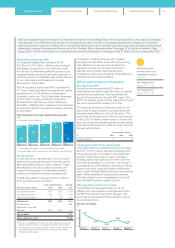
06 Financial review
10 Non-financial KPIs
12 Operating environment
14 Our vision and strategy
16 What we do
20 How we make money from our regulated assets
21 How our strategy creates value
22 Internal control and risk management
26 How executive remuneration aligns to Company strategy
29 Principal operations
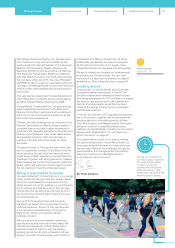
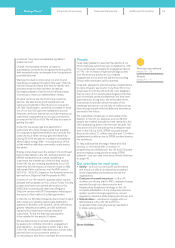
40 People
Corporate Governance pages 42 to 73
The Corporate Governance Report, introduced by the
Chairman, contains details about the activities of the Board
andits committees during the year, including reports from
the Audit, Nominations, Remuneration, Finance, and Safety,
Environment and Health Committees, aswell as details of our
shareholder engagement activities.
42 Corporate Governance contents
57 Directors’ Report statutory and other disclosures
58 Remuneration Report
Financial Statements pages 74 to 159
Including the independent auditors’ reports, consolidated
financial statements prepared in accordance with IFRS
andnotes to the consolidated financial statements, as well
asthe Company financial statements prepared in accordance
with UK GAAP.
74 Contents of financial statements
75 Introduction to the financial statements
76 Statement of Directors’ responsibilities
77 Independent auditors’ report
81 Report of Independent Registered Public Accounting Firm
Additional Information pages 160 to the
inside back cover
Additional disclosures and information, definitions and
glossary of terms, summary consolidated financial
information and other useful information for shareholders,
including contact details for more information or help.
160 Contents of Additional Information
188 Definitions and glossary of terms
Glossary
We use a number of technical terms and abbreviations within
thisdocument. For brevity, we do not define terms or provide
explanations every time they are used; please refer to the glossary
on pages 188 to 191 for this information.
01