National Grid 2014 Annual Report Download - page 156
Download and view the complete annual report
Please find page 156 of the 2014 National Grid annual report below. You can navigate through the pages in the report by either clicking on the pages listed below, or by using the keyword search tool below to find specific information within the annual report.-
 1
1 -
2
-
3
-
4
-
5
-
6
-
7
-
8
-
9
-
10
-
11
-
12
-
13
-
14
-
15
-
16
-
17
-
18
-
19
-
20
-
21
-
22
-
23
-
24
-
25
-
26
-
27
-
28
-
29
-
30
-
31
-
32
-
33
-
34
-
35
-
36
-
37
-
38
-
39
-
40
-
41
-
42
-
43
-
44
-
45
-
46
-
47
-
48
-
49
-
50
-
51
-
52
-
53
-
54
-
55
-
56
-
57
-
58
-
59
-
60
-
61
-
62
-
63
-
64
-
65
-
66
-
67
-
68
-
69
-
70
-
71
-
72
-
73
-
74
-
75
-
76
-
77
-
78
-
79
-
80
-
81
-
82
-
83
-
84
-
85
-
86
-
87
-
88
-
89
-
90
-
91
-
92
-
93
-
94
-
95
-
96
-
97
-
98
-
99
-
100
-
101
-
102
-
103
-
104
-
105
-
106
-
107
-
108
-
109
-
110
-
111
-
112
-
113
-
114
-
115
-
116
-
117
-
118
-
119
-
120
-
121
-
122
-
123
-
124
-
125
-
126
-
127
-
128
-
129
-
130
-
131
-
132
-
133
-
134
-
135
-
136
-
137
-
138
-
139
-
140
-
141
-
142
-
143
-
144
-
145
-
 146
146 -
 147
147 -
 148
148 -
 149
149 -
 150
150 -
 151
151 -
 152
152 -
 153
153 -
 154
154 -
 155
155 -
 156
156 -
 157
157 -
 158
158 -
 159
159 -
 160
160 -
 161
161 -
 162
162 -
 163
163 -
 164
164 -
 165
165 -
 166
166 -
167
-
168
-
169
-
170
-
171
-
172
-
173
-
174
-
175
-
176
-
177
-
178
-
179
-
180
-
181
-
182
-
183
-
184
-
185
-
186
-
187
-
188
-
189
-
190
-
191
-
192
-
193
-
194
-
195
-
196
 |
 |

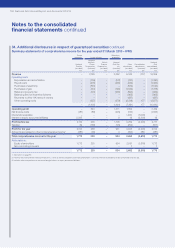
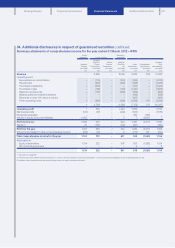
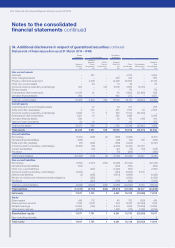
34. Additional disclosures in respect of guaranteed securities continued
Cash flow statements
Parent
guarantor Issuer of notes
Subsidiary
guarantor
National
Grid plc
£m
Niagara
Mohawk
Power
Corporation
£m
British
Transco
Finance Inc.
£m
National
Grid Gas
plc
£m
Other
subsidiaries
£m
Consolidation
adjustments
£m
National
Grid
consolidated
£m
Year ended 31 March 2014
Net cash flow from operating activities 52 581 –1,717 1,669 –4,019
Net cash flow from/(used in) investing activities 1,358 (555) –(91) (993) (1,049) (1,330)
Net cash flow (used in)/from financing activities (1,724) (18) –(1,632) (647) 1,049 (2,972)
Net (decrease)/increase in cash and cash
equivalentsinthe year (314) 8 – (6) 29 –(283)
Year ended 31 March 2013
Net cash flow from operating activities 36 162 –1,608 1,944 –3,750
Net cash flow used in investing activities (979) (286) –(1,345) (1,048) (2,472) (6,130 )
Net cash flow from/(used in) financing activities 1,255 132 –(240) (904) 2,472 2,715
Net increase/(decrease) in cash and cash
equivalentsintheyear 312 8 – 23 (8) – 335
Year ended 31 March 2012
Net cash flow from operating activities 75 441 –1,596 2,116 –4,228
Net cash flow from/(used in) investing activities 559 (287) –(1,171) (1,166) (306) (2,371)
Net cash flow (used in)/from financing activities (808) (155) –(502) ( 741) 306 (1,900)
Net (decrease)/increase in cash and cash
equivalentsintheyear (174) (1) –(77) 209 –(43)
Cash dividends were received by National Grid plc from subsidiary undertakings amounting to £1,050m during the year ended 31 March
2014 (2013: £570m; 2012: £200m).
Maturity analysis of parent Company borrowings
2014
£m
2013
£m
Total borrowings are repayable as follows:
Less than 1 year 1,327 613
In 1-2 years 46 835
In 2-3 years 580 51
In 3-4 years –642
In 4-5 years 506 –
More than 5 years 718 1,234
3,177 3,375
Notes to the consolidated
financial statements continued
154 National Grid Annual Report and Accounts 2013/14