National Grid 2014 Annual Report Download - page 71
Download and view the complete annual report
Please find page 71 of the 2014 National Grid annual report below. You can navigate through the pages in the report by either clicking on the pages listed below, or by using the keyword search tool below to find specific information within the annual report.-
 1
1 -
2
-
3
-
4
-
5
-
6
-
7
-
8
-
9
-
10
-
11
-
12
-
13
-
14
-
15
-
16
-
17
-
18
-
19
-
20
-
21
-
22
-
23
-
24
-
25
-
26
-
27
-
28
-
29
-
30
-
31
-
32
-
33
-
34
-
35
-
36
-
37
-
38
-
39
-
40
-
41
-
42
-
43
-
44
-
45
-
46
-
47
-
48
-
49
-
50
-
51
-
52
-
53
-
54
-
55
-
56
-
57
-
58
-
59
-
60
-
 61
61 -
 62
62 -
 63
63 -
 64
64 -
 65
65 -
 66
66 -
 67
67 -
 68
68 -
 69
69 -
 70
70 -
 71
71 -
 72
72 -
 73
73 -
 74
74 -
 75
75 -
 76
76 -
 77
77 -
 78
78 -
 79
79 -
 80
80 -
 81
81 -
82
-
83
-
84
-
85
-
86
-
87
-
88
-
89
-
90
-
91
-
92
-
93
-
94
-
95
-
96
-
97
-
98
-
99
-
100
-
101
-
102
-
103
-
104
-
105
-
106
-
107
-
108
-
109
-
110
-
111
-
112
-
113
-
114
-
115
-
116
-
117
-
118
-
119
-
120
-
121
-
122
-
123
-
124
-
125
-
126
-
127
-
128
-
129
-
130
-
131
-
132
-
133
-
134
-
135
-
136
-
137
-
138
-
139
-
140
-
141
-
142
-
143
-
144
-
145
-
146
-
147
-
148
-
149
-
150
-
151
-
152
-
153
-
154
-
155
-
156
-
157
-
158
-
159
-
160
-
161
-
162
-
163
-
164
-
165
-
166
-
167
-
168
-
169
-
170
-
171
-
172
-
173
-
174
-
175
-
176
-
177
-
178
-
179
-
180
-
181
-
182
-
183
-
184
-
185
-
186
-
187
-
188
-
189
-
190
-
191
-
192
-
193
-
194
-
195
-
196
 |
 |

Strategic Report Corporate Governance Financial Statements Additional Information
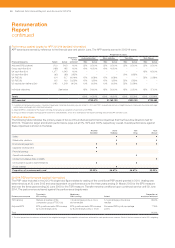
Total pension entitlements (audited information)
The table below provides details of the Executive Directors’ pension benefits:
Total
contributions
to DC-type
pension plan
£’000
Cash in lieu of
contributions
to DC-type
pension plan
£’000
Accrued
pension at
31 March 2014
£’000 pa
Increase
in accrued
pension over
year, net
of inflation
£’000 pa
Transfer value
of accrued
benefits as at
31 March 2014
£’000
Transfer value
of increase
in accrued
pension over
year, net
of inflation
£’000
Normal
retirement
date
Andrew Bonfield 28 185 ––––17/0 8/2027
Steve Holliday – – 506 17 13,013 379 26/10/2016
Tom King 8 – 491 55 4,112 462 01/01/2027
Nick Winser – – 284 10 6,341 173 06/09/2020
1. The UK-based Executive Directors participate in FPS, a salary sacrifice arrangement for pension contributions. Contributions paid via salary sacrifice have been deducted from the figures
in the tableabove.
2. For Steve Holliday, in addition to the pension above, there is an accrued lump sum entitlement of £125,000 as at 31 March 2014. There was no increase to the accumulated lump sum
including and excluding inflation in the year to 31 March 2014. The transfer value information above includes the value of the lump sum. Steve paid contributions of £44,000 via FPS.
3. For Nick Winser, in addition to the pension above, there is an accrued lump sum entitlement of £313,000 as at 31 March 2014. The increase to the accumulated lump sum including
inflationwas £7,000 and excluding inflation was £nil in the year to 31 March 2014. The transfer value information above includes the value of the lump sum. Nick paid contributions
of £33,000 via FPS.
4. For Tom King, the exchange rate as at 31 March 2014 was $1.67:£1 and as at 31 March 2013 was $1.52:£1. In addition to the transfer value quoted above, through participation in a
401(k)plan in the US, the Company made contributions worth £7,854 to a DC arrangement.
5. The increase in accrued pension figures for Steve Holliday and Nick Winser are net of inflation based on RPI for September 2013. The figures in the single figure table on page 67 are based
oninflation using CPI for September 2012. If the same inflation measure was used for this table the relevant figures would be an increase in pension of £23,100 for Steve and £12,250 for
Nick. Multiplying these figures by a factor of 20 and deducting member contributions correlates to the values in the single figure table. Tom King’s pension figures do not allow for inflation
as US pensions in payment or deferment do not increase in line with inflation. For Tom, multiplying the increase in accrued pension over the year, shown above (£55,150), by a factor of 20
and adding Company contributions to a DC-type pension plan, shown above, correlates to the value in the single figure table.
6. There are no additional benefits in the event of early retirement.
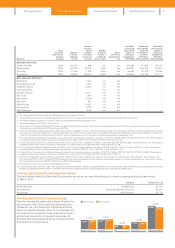
Single total figure of remuneration – Non-executive Directors (audited information)
The following table shows a single total figure in respect of qualifying service for 2013/14, together with comparative figures for 2012/13:
Fees
£’000
Other emoluments
£’000
Total
£’000
2013/14 2012/13 2013/14 2012/13 2013/14 2012/13
Philip Aiken 88 84 ––88 84
Nora Mead Brownell 88 73 ––88 73
Jonathan Dawson 84 6––84 6
Therese Esperdy 3–––3–
Sir Peter Gershon 475 475 17 17 492 492
Paul Golby 76 76 ––76 76
Ken Harvey 36 108 ––36 108
Ruth Kelly 76 76 ––76 76
Maria Richter 101 101 ––101 101
George Rose 30 91 ––30 91
Mark Williamson 99 44 ––99 44
Total 1,156 1,134 17 17 1,173 1,151
1. Sir Peter Gershon’s other emoluments comprise private medical insurance, cash in lieu of a car and the use of a driver when required.
Payments for loss of office or to past Directors (audited information)
No payments were made in 2013/14 for these circumstances.
69