National Grid 2014 Annual Report Download - page 103
Download and view the complete annual report
Please find page 103 of the 2014 National Grid annual report below. You can navigate through the pages in the report by either clicking on the pages listed below, or by using the keyword search tool below to find specific information within the annual report.
Strategic Report Corporate Governance Financial Statements Additional Information
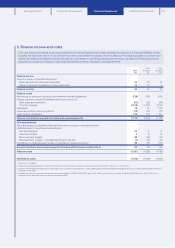
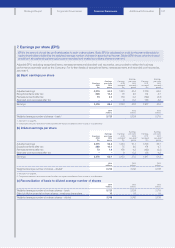
5. Finance income and costs
This note details the interest income generated by our financial assets and interest expense incurred on our financial liabilities. It also
includes the expected return on our pension and other post-retirement assets, which is offset by the interest payable on pension and
other post-retirement obligations and presented ona net basis. In reporting business performance, we adjust net financing costs to
exclude any net gains or losses on derivative financial instruments included inremeasurements.
2014
£m
2013
(restated)1
£m
2012
(restated)1
£m
Finance income
Interest income on financial instruments
Bank deposits and other financial assets 22 20 19
Gains on disposal of available-for-sale investments 14 10 9
Finance income 36 30 28
Finance costs
Net interest on pensions and other post-retirement benefit obligations (128) (135) (103)
Interest expense on financial liabilities held at amortised cost
Bank loans and overdrafts (61) (65) (84)
Other borrowings (1,109) (1,052) (1,10 5)
Derivatives 79 51 122
Unwinding of discounts on provisions (73) (75) (72)
Less: interest capitalised2148 122 124
Finance costs before exceptional items and remeasurements (1,144) (1,154) (1,118)
Remeasurements
Net gains/(losses) on derivative financial instruments included in remeasurements3:
Ineffectiveness on derivatives designated as:
Fair value hedges422 17 9
Cash flow hedges 4(7) 14
Net investment hedges 38 (26) (15)
Net investment hedges – undesignated forward rate risk (7) 26 39
Derivatives not designated as hedges or ineligible for hedge accounting 36 58 (117)
Exceptional items and remeasurements included within finance costs (note 4) 93 68 (70)
Finance costs (1,051) (1,086) (1,188)
Net finance costs (1,015) (1,056) (1,16 0)
1. See note 1 on page 92.
2. Interest on funding attributable to assets in the course of construction was capitalised during the year at a rate of 4.5% (2013: 4.4%; 2012: 5.2%).
3. Includes a net foreign exchange gain on financing activities of £268m (2013: £32m loss; 2012: £280m gain) offset by foreign exchange gains and losses on derivative financial instruments
measured at fair value.
4. Includes a net loss on instruments designated as fair value hedges of £183m (2013: £67m gain; 2012: £233m gain) offset by a net gain of £205m (2013: £50m loss; 2012: £224m loss)
arising fromfairvalue adjustments to the carrying value of debt.
101


