National Grid 2014 Annual Report Download - page 87
Download and view the complete annual report
Please find page 87 of the 2014 National Grid annual report below. You can navigate through the pages in the report by either clicking on the pages listed below, or by using the keyword search tool below to find specific information within the annual report.-
 1
1 -
2
-
3
-
4
-
5
-
6
-
7
-
8
-
9
-
10
-
11
-
12
-
13
-
14
-
15
-
16
-
17
-
18
-
19
-
20
-
21
-
22
-
23
-
24
-
25
-
26
-
27
-
28
-
29
-
30
-
31
-
32
-
33
-
34
-
35
-
36
-
37
-
38
-
39
-
40
-
41
-
42
-
43
-
44
-
45
-
46
-
47
-
48
-
49
-
50
-
51
-
52
-
53
-
54
-
55
-
56
-
57
-
58
-
59
-
60
-
61
-
62
-
63
-
64
-
65
-
66
-
67
-
68
-
69
-
70
-
71
-
72
-
73
-
74
-
75
-
76
-
 77
77 -
 78
78 -
 79
79 -
 80
80 -
 81
81 -
 82
82 -
 83
83 -
 84
84 -
 85
85 -
 86
86 -
 87
87 -
 88
88 -
 89
89 -
 90
90 -
 91
91 -
 92
92 -
 93
93 -
 94
94 -
 95
95 -
 96
96 -
 97
97 -
98
-
99
-
100
-
101
-
102
-
103
-
104
-
105
-
106
-
107
-
108
-
109
-
110
-
111
-
112
-
113
-
114
-
115
-
116
-
117
-
118
-
119
-
120
-
121
-
122
-
123
-
124
-
125
-
126
-
127
-
128
-
129
-
130
-
131
-
132
-
133
-
134
-
135
-
136
-
137
-
138
-
139
-
140
-
141
-
142
-
143
-
144
-
145
-
146
-
147
-
148
-
149
-
150
-
151
-
152
-
153
-
154
-
155
-
156
-
157
-
158
-
159
-
160
-
161
-
162
-
163
-
164
-
165
-
166
-
167
-
168
-
169
-
170
-
171
-
172
-
173
-
174
-
175
-
176
-
177
-
178
-
179
-
180
-
181
-
182
-
183
-
184
-
185
-
186
-
187
-
188
-
189
-
190
-
191
-
192
-
193
-
194
-
195
-
196
 |
 |

Strategic Report Corporate Governance Financial Statements Additional Information
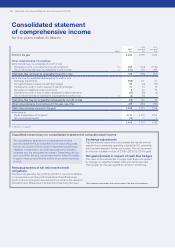
Unaudited commentary on the consolidated income statement
The consolidated income statement shows all revenue
earned and costs incurred in the year, with the difference
being the overall profit for the year.
Revenue
Revenue for the year ended 31 March 2014 increased by £450m
to £14,809m. This increase was driven by higher revenues in our
UKElectricity Transmission and UK Gas Distribution businesses,
principally as a result of the new RIIO regulatory arrangements.
Revenue in our US Regulated businesses was also higher,
reflecting higher pass-through costs such as gas and electricity
commodity costs, partially offset by the end of the Niagara
Mohawk deferral revenue recoveries at 31 March 2013 and the
impact of the weaker dollar.
Operating costs
Operating costs for the year ended 31 March 2014 of £11,074m
were £464m higher than the prior year. This increase in costs was
predominantly due to increases in pass-through costs in our UK
and US Regulated businesses, together with higher depreciation
and amortisation as a result of continued investment and increases
in our controllable costs.
Exceptional items, remeasurements and stranded cost recoveries
included in operating costs for the year ended 31 March 2014
were £39m lower than the prior year. Net exceptional gains
included in 2013/14 of £55m primarily consisted of a net gain
onthe LIPA MSA transition in the US of £254m, a gain of £16m
following the sale to a third party of a settlement award,
restructuring costs of £136m and UK gas holder demolition
costsof £79m. The 2013/14 results also included a gain of £16m
onremeasurements of commodity contracts.
There were no major storms affecting our operations in the year
ended 31 March 2014. In 2012/13, two major storms in the US,
Superstorm Sandy and Storm Nemo, increased operating costs
by£136m.
Net finance costs
For the year ended 31 March 2014, net finance costs before
exceptional items and remeasurements were £16m lower than
2012/13 at £1,108m, mainly due tothe impact of the weaker
dollar(£17m).
Finance costs for the year ended 31 March 2014 also included
again of £93m on financial remeasurements relating to net
gainsand losses on derivative financial instruments.
Taxation
The tax charge on profits before exceptional items, remeasurements
and stranded cost recoveries was £38m lower than 2012/13. This
was mainly due to a 1% decrease in the UK statutory corporation
tax rate in the year and a change in the UK/US profit mix where
higher UK profits were taxed at the lower UK tax rate. Our tax
charge was also affected by changes in tax provisions in respect
ofprior years.
Exceptional tax for 2013/14 included an exceptional deferredtax
credit of £398m arising from a reduction in theUKcorporation tax
rate from 23% to 21% applicable from1April 2014 and a further
reduction to 20% from 1 April 2015.
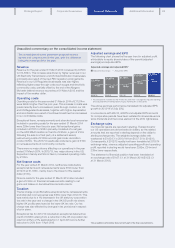
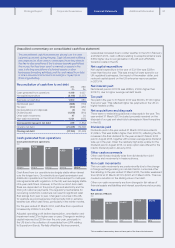
Adjusted earnings and EPS
The following chart shows the five year trend in adjusted profit
attributable to equity shareholders of the parent (adjusted
earnings) and adjusted EPS.
£1,447m£1,627m£1,709m
2009/10 2010/11 2011/12 2012/13 2013/14
£1,913m£2,015m
47.1p 45.4p 46.0p
51.4p 54.0p
Adjusted earnings and adjusted EPS1
Adjusted EPSAdjusted earnings
1. All comparatives restated for IAS 19 (revised). See note 1 on page 92. Adjusted earnings
and adjusted EPS are attributable to equity shareholders of the parent.
The above earnings performance translated into adjusted EPS
growth in 2013/14 of 2.6p (5%).
In accordance with IAS 33, all EPS and adjusted EPS amounts
forcomparative periods have been restated for shares issued via
scrip dividends and the bonus element of the 2010 rights issue.
Exchange rates
Our financial results are reported in sterling. Transactions for
ourUS operations are denominated in dollars, so the related
amounts that are reported in sterling depend on the dollar to
sterling exchange rate. The weighted average dollar rate
weakened to $1.62:£1 in 2013/14 from $1.57:£1 in 2012/13.
Consequently, if2012/13 results had been translated at 2013/14
exchange rates,revenue, adjusted operating profit and operating
profit reported in sterling would have been £242m, £34m and
£39m lower respectively.
The statement of financial position has been translated at
anexchange rate of $1.67:£1 at 31 March 2014 ($1.52: £1
at31March 2013).
This unaudited commentary does not form part of the financial statements.
85