National Grid 2014 Annual Report Download - page 94
Download and view the complete annual report
Please find page 94 of the 2014 National Grid annual report below. You can navigate through the pages in the report by either clicking on the pages listed below, or by using the keyword search tool below to find specific information within the annual report.-
 1
1 -
2
-
3
-
4
-
5
-
6
-
7
-
8
-
9
-
10
-
11
-
12
-
13
-
14
-
15
-
16
-
17
-
18
-
19
-
20
-
21
-
22
-
23
-
24
-
25
-
26
-
27
-
28
-
29
-
30
-
31
-
32
-
33
-
34
-
35
-
36
-
37
-
38
-
39
-
40
-
41
-
42
-
43
-
44
-
45
-
46
-
47
-
48
-
49
-
50
-
51
-
52
-
53
-
54
-
55
-
56
-
57
-
58
-
59
-
60
-
61
-
62
-
63
-
64
-
65
-
66
-
67
-
68
-
69
-
70
-
71
-
72
-
73
-
74
-
75
-
76
-
77
-
78
-
79
-
80
-
81
-
82
-
83
-
 84
84 -
 85
85 -
 86
86 -
 87
87 -
 88
88 -
 89
89 -
 90
90 -
 91
91 -
 92
92 -
 93
93 -
 94
94 -
 95
95 -
 96
96 -
 97
97 -
 98
98 -
 99
99 -
 100
100 -
 101
101 -
 102
102 -
 103
103 -
 104
104 -
105
-
106
-
107
-
108
-
109
-
110
-
111
-
112
-
113
-
114
-
115
-
116
-
117
-
118
-
119
-
120
-
121
-
122
-
123
-
124
-
125
-
126
-
127
-
128
-
129
-
130
-
131
-
132
-
133
-
134
-
135
-
136
-
137
-
138
-
139
-
140
-
141
-
142
-
143
-
144
-
145
-
146
-
147
-
148
-
149
-
150
-
151
-
152
-
153
-
154
-
155
-
156
-
157
-
158
-
159
-
160
-
161
-
162
-
163
-
164
-
165
-
166
-
167
-
168
-
169
-
170
-
171
-
172
-
173
-
174
-
175
-
176
-
177
-
178
-
179
-
180
-
181
-
182
-
183
-
184
-
185
-
186
-
187
-
188
-
189
-
190
-
191
-
192
-
193
-
194
-
195
-
196
 |
 |

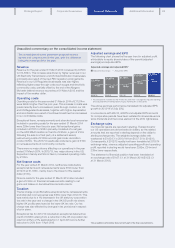
1. Adoption of IAS 19 (revised) ‘Employee benefits’
This note sets out the impact that the required adoption of IAS 19 (revised) ‘Employee benefits’ has had on our previously reported
results. It provides details of the originally reported and the restated figures.
During the year, the Group adopted IAS 19 (revised) ‘Employee benefits’. The adoption constitutes a change in accounting policy and
therefore the comparative information has been restated.
The standard requires past service costs to be recognised immediately in profit or loss and all actuarial gains and losses are recognised
in other comprehensive income as they occur. The standard also replaces the interest cost on the DB obligation and the expected return
on plan assets with a net interest cost based on the net DB asset or liability and the discount rate, measured at the beginning of the year.
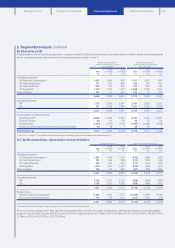
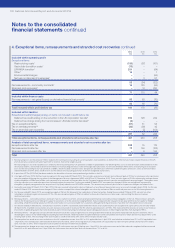
The impact on the Group for the years ended 31 March 2013 and 31 March 2012 is set out in the table below:
As previously reported
Restatement for
IAS 19 (revised) As restated
31 March
2013
£m
31 March
2012
£m
31 March
2013
£m
31 March
2012
£m
31 March
2013
£m
31 March
2012
£m
Consolidated income statement
Operating costs (10,605) (10,293) (5) (4) (10,610) (10,297)
Total operating profit 3,754 3,539 (5) (4) 3,749 3,535
Total finance income 1,252 1,301 (1,222) (1,273) 30 28
Total finance costs (2,104) (2,288) 1,018 1,10 0 (1,086) (1,188)
Total profit before tax 2,920 2,559 (209) (177) 2,711 2,382
Total taxation (624) (521) 67 58 (557) (463)
Profit for the year 2,296 2,038 (142) (119) 2,154 1,919
Consolidated statement of financial position
Deferred tax liabilities (4,076) (3,738) (1) 2(4,077) (3,736)
Pensions and other post-retirement benefit obligations (3,694) (3,088) 2(5) (3,692) (3,093)
Total non-current liabilities ( 37, 0 27 ) (31,998) 1(3) (37,026) (32,001)
Total liabilities (44,472) (38,089) 1(3) (44,471) (38,092)
Retained earnings 13,132 12,297 1(3) 13,133 12,294
Total equity 10,233 9,246 1(3) 10,234 9,243
Consolidated statement of other comprehensive income
Remeasurements of net retirement benefit obligations (930) (1,325) 216 185 (714) (1,140)
Tax on items that will never be reclassified to profit or loss 249 403 (70) (61) 179 342
Total comprehensive income for the year 1,769 1,151 4 5 1,773 1,156
Consolidated statement of changes in equity
Other comprehensive income (527) (887) 146 124 (381) (763)
Total comprehensive income for the year 1,769 1,151 4 5 1,773 1,156
Consolidated cash flow statement
Pensions and other post-retirement benefit obligations (413) (386) 5 4 (408) (382)
EPS – basic 62.6p 55.6p (4.8)p (4.0)p 57.8p 51.6p
EPS – diluted 62.3p 55.4p (4.8)p (4.1) p 57.5p 51.3p
The restated amounts for EPS in the above table reflect the impact of additional shares issued as scrip dividends. The effect of the change
in accounting policy on the statement of cash flows was immaterial, with no impact on the cash position at any of the reporting dates.
We have revised our pension and other post-retirement benefit obligations disclosures in notes 22 and 29 to provide greater clarity by
separately presenting our UK and US pension plans due to their different risk profiles.
Notes to the consolidated
financial statements
– analysis of items in the primary statements
92 National Grid Annual Report and Accounts 2013/14