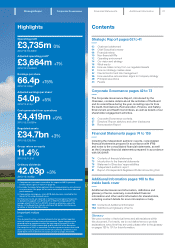
National Grid 2014 Annual Report Download - page 13
Download and view the complete annual report
Please find page 13 of the 2014 National Grid annual report below. You can navigate through the pages in the report by either clicking on the pages listed below, or by using the keyword search tool below to find specific information within the annual report.-
 1
1 -
2
-
 3
3 -
 4
4 -
 5
5 -
 6
6 -
 7
7 -
 8
8 -
 9
9 -
 10
10 -
 11
11 -
 12
12 -
 13
13 -
 14
14 -
 15
15 -
 16
16 -
 17
17 -
 18
18 -
 19
19 -
 20
20 -
 21
21 -
 22
22 -
 23
23 -
24
-
25
-
26
-
27
-
28
-
29
-
30
-
31
-
32
-
33
-
34
-
35
-
36
-
37
-
38
-
39
-
40
-
41
-
42
-
43
-
44
-
45
-
46
-
47
-
48
-
49
-
50
-
51
-
52
-
53
-
54
-
55
-
56
-
57
-
58
-
59
-
60
-
61
-
62
-
63
-
64
-
65
-
66
-
67
-
68
-
69
-
70
-
71
-
72
-
73
-
74
-
75
-
76
-
77
-
78
-
79
-
80
-
81
-
82
-
83
-
84
-
85
-
86
-
87
-
88
-
89
-
90
-
91
-
92
-
93
-
94
-
95
-
96
-
97
-
98
-
99
-
100
-
101
-
102
-
103
-
104
-
105
-
106
-
107
-
108
-
109
-
110
-
111
-
112
-
113
-
114
-
115
-
116
-
117
-
118
-
119
-
120
-
121
-
122
-
123
-
124
-
125
-
126
-
127
-
128
-
129
-
130
-
131
-
132
-
133
-
134
-
135
-
136
-
137
-
138
-
139
-
140
-
141
-
142
-
143
-
144
-
145
-
146
-
147
-
148
-
149
-
150
-
151
-
152
-
153
-
154
-
155
-
156
-
157
-
158
-
159
-
160
-
161
-
162
-
163
-
164
-
165
-
166
-
167
-
168
-
169
-
170
-
171
-
172
-
173
-
174
-
175
-
176
-
177
-
178
-
179
-
180
-
181
-
182
-
183
-
184
-
185
-
186
-
187
-
188
-
189
-
190
-
191
-
192
-
193
-
194
-
195
-
196
 |
 |
For more information
about our strategy
and strategic
elements see
pages 14 – 15
Strategic Report Corporate Governance Financial Statements Additional Information
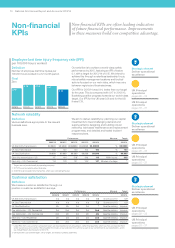
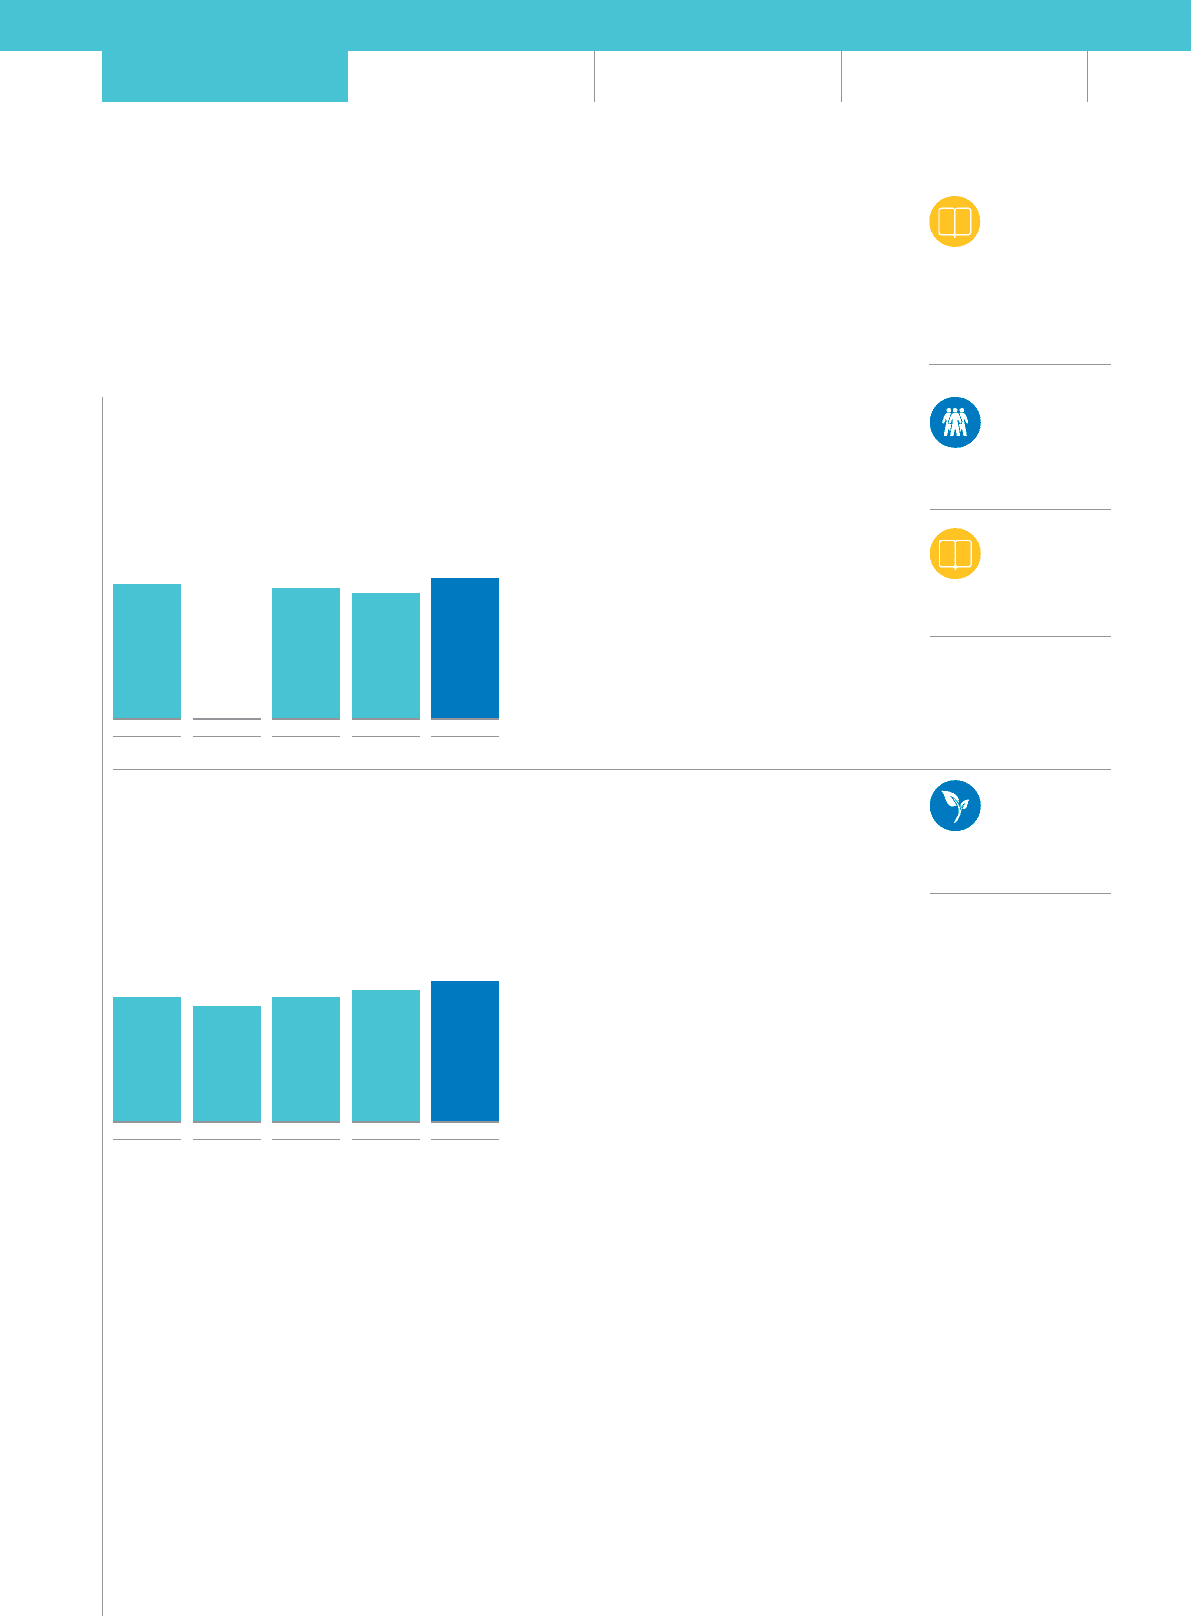
Employee engagement index
%
Strategic element
Engage our people
People
pages 40 – 41
Definition
Employee engagement index calculated
usingresponses to our employee survey.
Target
To increase
2009/10 2010/11 2011/12 2012/13 2013/14
68
Not
measured
66 63
71
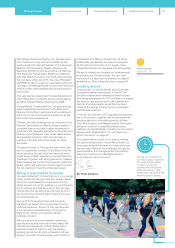
We measure employee engagement through our
employee opinion survey. The results of our 2014
survey, which was completed by 78% of our
employees, have helped us identify specific areas
where we are performing well and those areas we
need to improve.
Our engagement index has risen by eight points
to71%, our highest engagement score since
westarted conducting Group-wide employee
opinionsurveys.
Managers receive a scorecard that aims to create
greater leadership accountability and we produce
survey reports and action plans at Company,
regional, business unit, function and teamlevels.
Greenhouse gas emissions
% reduction against 1990 baseline
Strategic element
Embed sustainability
Definition
Percentage reduction in greenhouse
gas emissions against our 1990baseline.
Target
45% reduction by 2020 and
80%reduction by 2050
2009/10 2010/11 2011/12 2012/13 2013/14
55 51 55 58 62
Our total Scope 1 and Scope 2 greenhouse gas
emissions (excluding electricity transmission and
distribution line losses) for 2013/14 were around
7.4million tonnes carbon dioxide equivalent
(Scope1 was 7.2 and Scope 2 was 0.2). This is
equivalent to an intensity of 501 tonnes carbon
dioxide equivalent per £million of revenue for 2013/14.
The 2013/14 emissions quantity represents a
62%reduction from our 1990 baseline and a 9%
reduction from our 2012/13 emissions. Although our
outturn is better than our 2020 target, we will need
to innovate if we are to meet the target for 2050.
We have remained focused on greenhouse gas
emissions reduction programmes to achieve our
corporate commitment targets of 45% and 80%
reduction in Scope 1 and 2 emissions by 2020
and2050 respectively from our 1990 baseline.
We continue to look for innovations and efficiencies
that will help us achieve these targets. In 2013 we
significantly improved our scores in the CDP Global
500 ratings and were admitted for the first time to
the Global Leaders Index for carbon disclosure.
We measure and report our greenhouse gas
emissions in accordance with the WRI/WBCSD
Greenhouse Gas Protocol: Corporate Accounting
and Reporting Standard (Revised Edition) for all six
Kyoto gases, using the operational control approach
for emissions accounting.
These Scope 1 and 2 emissions are independently
assured against the international standard ISO
14064-3 Greenhouse Gas assurance protocol.
Acopy of this statement of assurance is available
onour website.
In the UK we have experienced a mild year, which
has been beneficial to the overall emissions of many
of our business units. Inthe UK activities at Grain
LNG have led to a 60% reduction of energy
consumption of on-site nitrogen production. Our
Electricity Transmission business has reduced SF6
leak rates to 1.2% in 2013/14 compared with 1.7%
inthe previous year and our Property function has
delivered a 2% year-on-year reduction in electricity-
related emissions across occupied sites.
In the US we have completed power plant turbine
efficiency upgrades in Long Island and continued
tofocus on efficiency-related maintenance
programmes. This has contributed towards
outperforming our LIPA contractual efficiency target.
Our US and UK Gas Distribution businesses have
continued to deliver significant reductions in
emissions in line with forecasts.
11