National Grid 2014 Annual Report Download - page 89
Download and view the complete annual report
Please find page 89 of the 2014 National Grid annual report below. You can navigate through the pages in the report by either clicking on the pages listed below, or by using the keyword search tool below to find specific information within the annual report.-
 1
1 -
2
-
3
-
4
-
5
-
6
-
7
-
8
-
9
-
10
-
11
-
12
-
13
-
14
-
15
-
16
-
17
-
18
-
19
-
20
-
21
-
22
-
23
-
24
-
25
-
26
-
27
-
28
-
29
-
30
-
31
-
32
-
33
-
34
-
35
-
36
-
37
-
38
-
39
-
40
-
41
-
42
-
43
-
44
-
45
-
46
-
47
-
48
-
49
-
50
-
51
-
52
-
53
-
54
-
55
-
56
-
57
-
58
-
59
-
60
-
61
-
62
-
63
-
64
-
65
-
66
-
67
-
68
-
69
-
70
-
71
-
72
-
73
-
74
-
75
-
76
-
77
-
78
-
 79
79 -
 80
80 -
 81
81 -
 82
82 -
 83
83 -
 84
84 -
 85
85 -
 86
86 -
 87
87 -
 88
88 -
 89
89 -
 90
90 -
 91
91 -
 92
92 -
 93
93 -
 94
94 -
 95
95 -
 96
96 -
 97
97 -
 98
98 -
 99
99 -
100
-
101
-
102
-
103
-
104
-
105
-
106
-
107
-
108
-
109
-
110
-
111
-
112
-
113
-
114
-
115
-
116
-
117
-
118
-
119
-
120
-
121
-
122
-
123
-
124
-
125
-
126
-
127
-
128
-
129
-
130
-
131
-
132
-
133
-
134
-
135
-
136
-
137
-
138
-
139
-
140
-
141
-
142
-
143
-
144
-
145
-
146
-
147
-
148
-
149
-
150
-
151
-
152
-
153
-
154
-
155
-
156
-
157
-
158
-
159
-
160
-
161
-
162
-
163
-
164
-
165
-
166
-
167
-
168
-
169
-
170
-
171
-
172
-
173
-
174
-
175
-
176
-
177
-
178
-
179
-
180
-
181
-
182
-
183
-
184
-
185
-
186
-
187
-
188
-
189
-
190
-
191
-
192
-
193
-
194
-
195
-
196
 |
 |

Strategic Report Corporate Governance Financial Statements Additional Information
Called up
share
capital
£m
Share
premium
account
£m
Retained
earnings
£m
Other
equity
reserves1
£m
Total
shareholders’
equity
£m
Non-
controlling
interests
£m
Total
equity
£m
Equity as at 1 April 2011 as previously reported 416 1,361 12,15 3 (4,870) 9,060 99,069
Impact of change in accounting policy2– – (8) –(8) –(8)
Equity as at 1 April 2011 (restated) 416 1,361 12,145 (4,870) 9,052 99,061
Profit for the year2– – 1,917 –1,917 21,919
Total other comprehensive (loss)/income for the year2– – (798) 35 (763) –(763)
Total comprehensive income for the year2– – 1,119 35 1,15 4 21,156
Equity dividends – – (1,319) –(1,319) –(1,319)
Scrip dividend related share issue36(6) 313 –313 –313
Issue of treasury shares – – 13 –13 –13
Purchase of own shares – – (4) –(4) –(4)
Other movements in non-controlling interests –––––(4) (4)
Share-based payment – – 24 –24 –24
Tax on share-based payment – – 3 – 3 – 3
At 31 March 2012 (restated) 422 1,355 12,294 (4,835) 9,236 79,243
Profit for the year2– – 2,15 3 –2,153 12,15 4
Total other comprehensive (loss)/income for the year2– – (535) 154 (381) –(381)
Total comprehensive income for the year2– – 1,618 154 1,772 11,773
Equity dividends – – (1,433) –(1,433) –(1,433)
Scrip dividend related share issue311 (11) 623 –623 –623
Issue of treasury shares – – 19 –19 –19
Purchase of own shares – – (6) –(6) –(6)
Other movements in non-controlling interests –––––(3) (3)
Share-based payment – – 20 –20 –20
Tax on share-based payment – – (2) –(2) –(2)
At 31 March 2013 (restated) 433 1,344 13,133 (4,681) 10,229 510,234
Profit for the year – – 2,476 –2,476 (12) 2,464
Total other comprehensive income/(loss) for the year – – 313 (78) 235 –235
Total comprehensive income/(loss) for the year – – 2,789 (78) 2,711 (12) 2,699
Equity dividends – – (1,503) –(1,503) –(1,503)
Scrip dividend related share issue36(8) 444 –442 –442
Issue of treasury shares – – 14 –14 –14
Purchase of own shares – – (5) –(5) –(5)
Other movements in non-controlling interests – – (4) –(4) 15 11
Share-based payment – – 20 –20 –20
Tax on share-based payment – – 7 – 7 – 7
At 31 March 2014 439 1,336 14,895 (4,759) 11,911 811,919
1. For further details of other equity reserves, see note 25 on page 129.
2. See note 1 on page 92.
3. Included within share premium account are costs associated with scrip dividends.
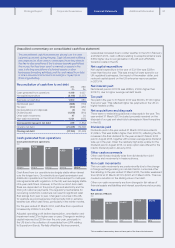
Unaudited commentary on consolidated statement of changes in equity
The consolidated statement of changes in equity shows the
additions (where it came from) and reductions (where it went)
to equity. For us, the main items included here are the profit
earned and dividends paid in the year.
Dividends
We paid a total of £1,503m dividends to shareholders in the
year(2012/13: £1,433m) of which £444m (2012/13: £623m)
wassettled via scrip issues. The Directors are proposing a
finaldividend of 27.54p, bringing the total dividend forthe year
to42.03p, a2.9% increase on 2012/13. The Directors intend to
continue the dividend policy announced last year of increasing
the annual dividend by at least the rate of RPI inflation for the
foreseeable future.
Consolidated statement
of changes in equity
for the years ended 31 March
This unaudited commentary does not form part of the financial statements.
87