National Grid 2014 Annual Report Download - page 8
Download and view the complete annual report
Please find page 8 of the 2014 National Grid annual report below. You can navigate through the pages in the report by either clicking on the pages listed below, or by using the keyword search tool below to find specific information within the annual report.-
 1
1 -
 2
2 -
 3
3 -
 4
4 -
 5
5 -
 6
6 -
 7
7 -
 8
8 -
 9
9 -
 10
10 -
 11
11 -
 12
12 -
 13
13 -
 14
14 -
 15
15 -
 16
16 -
 17
17 -
 18
18 -
 19
19 -
20
-
21
-
22
-
23
-
24
-
25
-
26
-
27
-
28
-
29
-
30
-
31
-
32
-
33
-
34
-
35
-
36
-
37
-
38
-
39
-
40
-
41
-
42
-
43
-
44
-
45
-
46
-
47
-
48
-
49
-
50
-
51
-
52
-
53
-
54
-
55
-
56
-
57
-
58
-
59
-
60
-
61
-
62
-
63
-
64
-
65
-
66
-
67
-
68
-
69
-
70
-
71
-
72
-
73
-
74
-
75
-
76
-
77
-
78
-
79
-
80
-
81
-
82
-
83
-
84
-
85
-
86
-
87
-
88
-
89
-
90
-
91
-
92
-
93
-
94
-
95
-
96
-
97
-
98
-
99
-
100
-
101
-
102
-
103
-
104
-
105
-
106
-
107
-
108
-
109
-
110
-
111
-
112
-
113
-
114
-
115
-
116
-
117
-
118
-
119
-
120
-
121
-
122
-
123
-
124
-
125
-
126
-
127
-
128
-
129
-
130
-
131
-
132
-
133
-
134
-
135
-
136
-
137
-
138
-
139
-
140
-
141
-
142
-
143
-
144
-
145
-
146
-
147
-
148
-
149
-
150
-
151
-
152
-
153
-
154
-
155
-
156
-
157
-
158
-
159
-
160
-
161
-
162
-
163
-
164
-
165
-
166
-
167
-
168
-
169
-
170
-
171
-
172
-
173
-
174
-
175
-
176
-
177
-
178
-
179
-
180
-
181
-
182
-
183
-
184
-
185
-
186
-
187
-
188
-
189
-
190
-
191
-
192
-
193
-
194
-
195
-
196
 |
 |

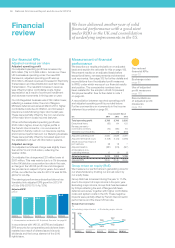
Financial
review
We have delivered another year of solid
nancial performance with a good start
underRIIO in the UK and consolidation
ofunderlying improvements in the US.
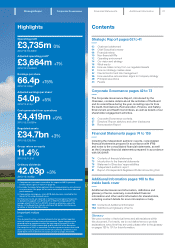
Our financial KPIs
Adjusted earnings per share
Adjusted operating profit
Our adjusted operating profit has increased by
£25million (1%) to £3,664 million. Across our three
UK businesses operating under the new RIIO
framework, adjusted operating profit was up
£34million. Allowed revenues increased in Electricity
Transmission and Gas Distribution and fell in Gas
Transmission. The resultant increase in revenue
wasoffset by higher controllable costs, higher
depreciation as a result of continued investment
andadverse movements in timing year on year.
Our US Regulated business was £129 million lower,
reflecting a weaker dollar, the end of Niagara
Mohawk deferral recoveries at March 2013, higher
controllable costs due to inflation, and increased
insurance costs following major storms last year.
These were partially offset by the non-recurrence
ofthe major storm costs incurred last year.
Other activities adjusted operating profit was
£120million higher, driven by higher profits in
theFrench interconnector, non-recurrence of
Superstorm Sandy costs in our insurance captive,
and improved performance in our Metering business.
These were partially offset by increased spend on
the stabilisation of new US information systems.
Adjusted earnings
Our adjusted net interest charge was slightly lower
than 2012/13 at £1,108 million, reflecting the
weakerdollar.
Our adjusted tax charge was £38 million lower at
£581 million. This was mainly due to a 1% decrease
in the UK statutory corporation tax rate in the year,
achange in the UK/US profit mix and changes in
taxprovisions in respect of prior years. As a result
ofthis, our effective tax rate for 2013/14 was 22.5%
(2012/13: 24.4%).
The earnings performance described above has
translated into adjusted EPS growth in 2013/14
of2.6p (5%) (2012/13: 5.4p, 12%).
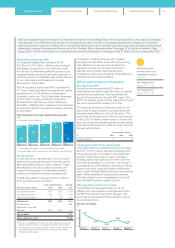
Adjusted EPS1
pence
2009/10 2010/11 2011/12 2012/13 2013/14
47.1 45.4 46.0
51.4 54.0
1. All comparatives restated for IAS 19 (revised). See note 1 on page 92.
In accordance with IAS 33, all EPS and adjusted
EPS amounts for comparative periods have been
restated as a result of shares issued via scrip
dividends and the bonus element of the 2010
rightsissue.
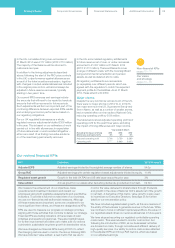
Measurement of financial
performance
We describe our results principally on an adjusted
basis and explain the rationale for this on page 182.
We present results on an adjusted basis before
exceptional items, remeasurements and stranded
cost recoveries. See page 182 for further details and
reconciliations from the adjusted profit measures
toIFRS, under which we report our financial results
and position. The comparative numbers have
beenrestated for the adoption of IAS 19 (revised)
‘Employee benefits’. See further detail in note 1
onpage 92.
A reconciliation between reported operating profit
and adjusted operating profit is provided below.
Further commentary on movements in the income
statement is provided on page 85.
Year ended 31 March
£m 2014 2013 2012
Total operating profit 3,735 3,749 3,535
Exceptional items (55) 84 122
Remeasurements –
commodity contracts (16) (180) 94
Stranded cost recoveries –(14) (260)
Adjusted operating profit 3,664 3,639 3,491
Adjusted net finance costs (1,108) (1,124) (1,090)
Share of post-tax results of
joint ventures 28 18 7
Adjusted taxation (581) (619) (697)
Attributable to non-
controlling interests 12 (1) (2)
Adjusted earnings 2,015 1,913 1,709
Adjusted EPS 54.0p 51.4p 46.0p
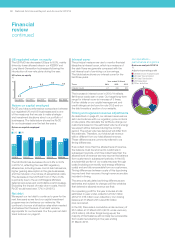
Group return on equity (RoE)
We measure our performance in generating value for
our shareholders by dividing our annual return by
our equity base.
Group RoE has increased during the year to 11.4%,
due to the impact of major storms in the prior year.
Excluding major storms, Group RoE has decreased
by 30bps reflecting the end of Niagara Mohawk
deferral recoveries, together with higher controllable
costs and system costs in the US. These negative
impacts were partially offset by French interconnector
performance and the lower UK tax rate.
Group return on equity
%
2009/10 2010/11 2011/12 2012/13 2013/14
10
11
13
12
10.9
11.3
10.8
12.6
11.2
11.7 11.4
Including major storms Excluding major storms
Our revised
financialKPIs
page 09
Exchange rates
page 85
Use of adjusted
profitmeasures
page 182
Reconciliations
ofadjusted profit
measures
page 182
06 National Grid Annual Report and Accounts 2013/14