National Grid 2014 Annual Report Download - page 11
Download and view the complete annual report
Please find page 11 of the 2014 National Grid annual report below. You can navigate through the pages in the report by either clicking on the pages listed below, or by using the keyword search tool below to find specific information within the annual report.-
 1
1 -
 2
2 -
 3
3 -
 4
4 -
 5
5 -
 6
6 -
 7
7 -
 8
8 -
 9
9 -
 10
10 -
 11
11 -
 12
12 -
 13
13 -
 14
14 -
 15
15 -
 16
16 -
 17
17 -
 18
18 -
 19
19 -
 20
20 -
 21
21 -
 22
22 -
23
-
24
-
25
-
26
-
27
-
28
-
29
-
30
-
31
-
32
-
33
-
34
-
35
-
36
-
37
-
38
-
39
-
40
-
41
-
42
-
43
-
44
-
45
-
46
-
47
-
48
-
49
-
50
-
51
-
52
-
53
-
54
-
55
-
56
-
57
-
58
-
59
-
60
-
61
-
62
-
63
-
64
-
65
-
66
-
67
-
68
-
69
-
70
-
71
-
72
-
73
-
74
-
75
-
76
-
77
-
78
-
79
-
80
-
81
-
82
-
83
-
84
-
85
-
86
-
87
-
88
-
89
-
90
-
91
-
92
-
93
-
94
-
95
-
96
-
97
-
98
-
99
-
100
-
101
-
102
-
103
-
104
-
105
-
106
-
107
-
108
-
109
-
110
-
111
-
112
-
113
-
114
-
115
-
116
-
117
-
118
-
119
-
120
-
121
-
122
-
123
-
124
-
125
-
126
-
127
-
128
-
129
-
130
-
131
-
132
-
133
-
134
-
135
-
136
-
137
-
138
-
139
-
140
-
141
-
142
-
143
-
144
-
145
-
146
-
147
-
148
-
149
-
150
-
151
-
152
-
153
-
154
-
155
-
156
-
157
-
158
-
159
-
160
-
161
-
162
-
163
-
164
-
165
-
166
-
167
-
168
-
169
-
170
-
171
-
172
-
173
-
174
-
175
-
176
-
177
-
178
-
179
-
180
-
181
-
182
-
183
-
184
-
185
-
186
-
187
-
188
-
189
-
190
-
191
-
192
-
193
-
194
-
195
-
196
 |
 |

Strategic Report Corporate Governance Financial Statements Additional Information
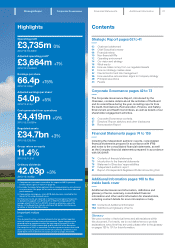
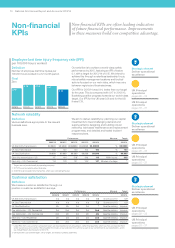
Non-financial KPIs
pages 10 – 11
Our vision
andstrategy
pages 14 – 15
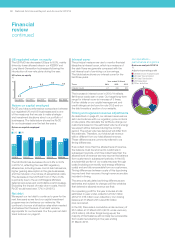
Our revised financial KPIs
KPI Definition 2013/14 result
Adjusted EPS Adjusted earnings divided by the weighted average number of shares. 54.0p
Group RoE Adjusted earnings with certain regulatory-based adjustments divided by equity. 11.4%
Regulated asset growth Growth in the total UK RAV and US rate base versus the prior year. 3%
Value added Annual growth in our assets after deducting dividends, goodwill and net debt. £ 2.1b n
We measure the achievement of our objectives, make
operational and investment decisions and reward our
employees using both qualitative assessments and quantitative
indicators. To provide a full and rounded view of our business,
we use non-financial as well as financial measures. Although
allthese measures are important, some are considered to be
more significant than others, and these are designated as KPIs.
KPIs are used to measure our progress on strategic priorities,
aligning with those activities that combine to deliver our strategy.
Financial KPIs are trailing indicators of the success of past
initiatives and specific programmes. They also highlight areas
for further improvement and allow us to make sure our actions
culminate in sustainable long-term growth in shareholder value.
We have changed our financial KPIs during 2013/14 to reflect
thechanging metrics used to monitor the Group following RIIO.
We have included ‘value added’, a new metric that we use to
monitor the value delivered to shareholders through dividends
and growth in the value of National Grid’s assets net of the growth
in net debt. A derivative of this metric, value growth, is also used
to incentivise our Executive Directors. See page 58 for further
detail on our remuneration policy.
We have included regulated asset growth, as this is a measure of
the ability of the business to generate revenue in the future. While
we continue to focus on efficient capital expenditure, the value of
our regulated assets drives our revenue allowances in future years.
We have stopped reporting our regulated controllable operating
costs metric. This was included to monitor cost control, but
following the introduction of RIIO, all our businesses’ activities
arefocused on costs, through innovative and efficient delivery of
high-quality services. Our ability to control costs is also reflected
in the adjusted EPS and Group RoE metrics, which are based
onour adjusted earnings.
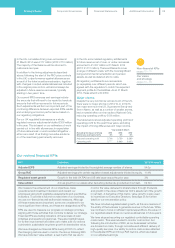
In the US, cumulative timing over-recoveries at
31March 2014 were £117 million (2013: £110 million).
The majority of that balance will be returned to
customers next year.
In addition to the timing adjustments described
above, following the start of the RIIO price controls
inthe UK, outperformance against allowances as
aresult of the totex incentive mechanism, together
with changes in output-related allowances included
in the original price control, will almost always be
adjusted in future revenue recoveries, typically
starting in two years’ time.
Our current IFRS revenues and earnings include
theamounts that will need toberepaid but exclude
amounts that will be recovered in future periods.
Such adjustments willform an important part of the
continuing difference between reported IFRS results
and underlying economic performance based on
ourregulatory obligations.
For our UK regulated businesses as a whole,
regulated revenue adjustments totalled £106 million
in the year. This is based on our estimates of: work
carried out in line with allowances; in expectation
offuture allowances; or work avoided altogether –
either as a result of us finding innovative solutions
orof the need being permanently removed.
In the US, accumulated regulatory entitlements
tofuture revenue net of over- or under-recoveries
amounted to £1,027 million at 31 March 2014
(2013:£1,311 million). These entitlements cover
arange of different areas, with the most significant
being environmental remediation and pension
assets, as well as deferred storm costs.
All regulatory entitlements are recoverable
(orrepayable) over different periods, which are
agreed with the regulators to match the expected
payment profile for the liabilities. As at 31 March
2014, these extend until 2059.
Major storms
Despite the very cold winter across much of the US,
there were no major storms in 2013/14. In 2012/13,
two major storms in the US, Superstorm Sandy and
Storm Nemo, as well as a number of smaller storms,
had a material effect on the results of National Grid,
reducing operating profit by £136million.
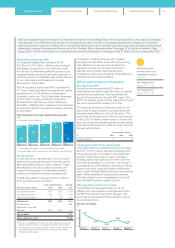
The table below shows adjusted operating profit and
operating profit for the past three years, excluding
the impact of timing differences and major storms.
Year ended 31 March
Excluding the impact of timing
differences and major storms
2014
£m
2013
£m
2012
£m
Adjusted operating profit 3,706 3,759 3,589
Operating profit 3,777 3,869 3,633
09