National Grid 2014 Annual Report Download - page 115
Download and view the complete annual report
Please find page 115 of the 2014 National Grid annual report below. You can navigate through the pages in the report by either clicking on the pages listed below, or by using the keyword search tool below to find specific information within the annual report.-
 1
1 -
2
-
3
-
4
-
5
-
6
-
7
-
8
-
9
-
10
-
11
-
12
-
13
-
14
-
15
-
16
-
17
-
18
-
19
-
20
-
21
-
22
-
23
-
24
-
25
-
26
-
27
-
28
-
29
-
30
-
31
-
32
-
33
-
34
-
35
-
36
-
37
-
38
-
39
-
40
-
41
-
42
-
43
-
44
-
45
-
46
-
47
-
48
-
49
-
50
-
51
-
52
-
53
-
54
-
55
-
56
-
57
-
58
-
59
-
60
-
61
-
62
-
63
-
64
-
65
-
66
-
67
-
68
-
69
-
70
-
71
-
72
-
73
-
74
-
75
-
76
-
77
-
78
-
79
-
80
-
81
-
82
-
83
-
84
-
85
-
86
-
87
-
88
-
89
-
90
-
91
-
92
-
93
-
94
-
95
-
96
-
97
-
98
-
99
-
100
-
101
-
102
-
103
-
104
-
 105
105 -
 106
106 -
 107
107 -
 108
108 -
 109
109 -
 110
110 -
 111
111 -
 112
112 -
 113
113 -
 114
114 -
 115
115 -
 116
116 -
 117
117 -
 118
118 -
 119
119 -
 120
120 -
 121
121 -
 122
122 -
 123
123 -
 124
124 -
 125
125 -
126
-
127
-
128
-
129
-
130
-
131
-
132
-
133
-
134
-
135
-
136
-
137
-
138
-
139
-
140
-
141
-
142
-
143
-
144
-
145
-
146
-
147
-
148
-
149
-
150
-
151
-
152
-
153
-
154
-
155
-
156
-
157
-
158
-
159
-
160
-
161
-
162
-
163
-
164
-
165
-
166
-
167
-
168
-
169
-
170
-
171
-
172
-
173
-
174
-
175
-
176
-
177
-
178
-
179
-
180
-
181
-
182
-
183
-
184
-
185
-
186
-
187
-
188
-
189
-
190
-
191
-
192
-
193
-
194
-
195
-
196
 |
 |

Strategic Report Corporate Governance Financial Statements Additional Information
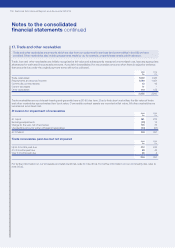
13. Financial and other investments
Financial and other investments includes two main categories. Assets classified as available-for-sale typically represent investments
in short-term money funds and quoted investments in equities or bonds of other companies. The second category is loans and
receivables which includes bank deposits with a maturity of greater than three months, and cash balances that cannot be readily used
in operations, principally collateral pledged for certain borrowings and restricted cash balances relating to our UK pension schemes.
Financial assets, liabilities and equity instruments are classified according to the substance of the contractual arrangements entered
into,and recognised on trade date. Available-for-sale financial assets are non-derivatives that are either designated in this category or
not classified in any other categories.
Available-for-sale financial investments are recognised at fair value plus directly related incremental transaction costs, and are subsequently
carried at fair value in the statement of financial position. Changes in the fair value of available-for-sale investments are recognised
directly in equity, until the investment is disposed of or is determined to be impaired. At this time the cumulative gain or loss previously
recognised in equity is included in the income statement for the period. Investment income is recognised using the effective interest
method and taken through interest income in the income statement.
Loans receivable and other receivables are initially recognised at fair value and subsequently held at amortised cost using the effective
interest method. Interest income, together with gains and losses when the loans and receivables are derecognised or impaired, are
recognised in the income statement.
Subsequent to initial recognition, the fair values of financial assets measured at fair value that are quoted in active markets are based on
bid prices. When independent prices are not available, fair values are determined by using valuation techniques that are consistent with
techniques commonly used by the relevant market. The techniques use observable market data.
2014
£m
2013
£m
Non-current
Available-for-sale investments 284 278
Current
Available-for-sale investments 2,716 4,441
Loans and receivables 883 990
3,599 5,431
Total financial and other investments 3,883 5,709
Financial and other investments include the following:
Investments in short-term money funds 2,165 4,120
Managed investments in equity and bonds1465 453
Bank deposits1355 165
Cash surrender value of life insurance policies 140 145
Other investments 24
Restricted balances2756 822
3,883 5,709
1. Includes £296m (2013: £296m) of current investments which are held by insurance captives and are therefore restricted.
2. Principally comprises collateral placed with counterparties with whom we have entered into a credit support annex to the ISDA Master Agreement £402m (2013: £507m), and assets held
within security accounts, with charges in favour of the UK pension schemes Trustees of £234m (2013: £179m).
Available-for-sale investments are recorded at fair value. Due to their short maturities the carrying value of loans and receivables
approximates their fair value. The maximum exposure to credit risk at the reporting date is the fair value of the financial investments.
Forfurther information on our credit risk, refer to note 30 (a). None of the financial investments are past due or impaired.
113