National Grid 2014 Annual Report Download - page 88
Download and view the complete annual report
Please find page 88 of the 2014 National Grid annual report below. You can navigate through the pages in the report by either clicking on the pages listed below, or by using the keyword search tool below to find specific information within the annual report.-
 1
1 -
2
-
3
-
4
-
5
-
6
-
7
-
8
-
9
-
10
-
11
-
12
-
13
-
14
-
15
-
16
-
17
-
18
-
19
-
20
-
21
-
22
-
23
-
24
-
25
-
26
-
27
-
28
-
29
-
30
-
31
-
32
-
33
-
34
-
35
-
36
-
37
-
38
-
39
-
40
-
41
-
42
-
43
-
44
-
45
-
46
-
47
-
48
-
49
-
50
-
51
-
52
-
53
-
54
-
55
-
56
-
57
-
58
-
59
-
60
-
61
-
62
-
63
-
64
-
65
-
66
-
67
-
68
-
69
-
70
-
71
-
72
-
73
-
74
-
75
-
76
-
77
-
 78
78 -
 79
79 -
 80
80 -
 81
81 -
 82
82 -
 83
83 -
 84
84 -
 85
85 -
 86
86 -
 87
87 -
 88
88 -
 89
89 -
 90
90 -
 91
91 -
 92
92 -
 93
93 -
 94
94 -
 95
95 -
 96
96 -
 97
97 -
 98
98 -
99
-
100
-
101
-
102
-
103
-
104
-
105
-
106
-
107
-
108
-
109
-
110
-
111
-
112
-
113
-
114
-
115
-
116
-
117
-
118
-
119
-
120
-
121
-
122
-
123
-
124
-
125
-
126
-
127
-
128
-
129
-
130
-
131
-
132
-
133
-
134
-
135
-
136
-
137
-
138
-
139
-
140
-
141
-
142
-
143
-
144
-
145
-
146
-
147
-
148
-
149
-
150
-
151
-
152
-
153
-
154
-
155
-
156
-
157
-
158
-
159
-
160
-
161
-
162
-
163
-
164
-
165
-
166
-
167
-
168
-
169
-
170
-
171
-
172
-
173
-
174
-
175
-
176
-
177
-
178
-
179
-
180
-
181
-
182
-
183
-
184
-
185
-
186
-
187
-
188
-
189
-
190
-
191
-
192
-
193
-
194
-
195
-
196
 |
 |

Notes
2014
£m
2013
(restated)1
£m
2012
(restated)1
£m
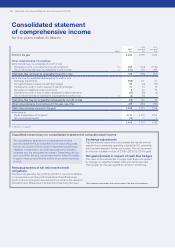
Profit for the year 2,464 2,154 1,919
Other comprehensive income/(loss)
Items that will never be reclassified to profit or loss
Remeasurements of net retirement benefit obligations 22 485 (714) (1,14 0)
Tax on items that will never be reclassified to profit or loss 6(172) 179 342
Total items that will never be reclassified to profit or loss 313 (535) (798)
Items that may be reclassified subsequently to profit or loss
Exchange adjustments (158) 117 27
Net gains/(losses) in respect of cash flow hedges 63 (31) (18)
Transferred to profit or loss in respect of cash flow hedges 27 73 19
Net gains on available-for-sale investments 620 16
Transferred to profit or loss on sale of available-for-sale investments (14) (10) (9)
Tax on items that may be reclassified subsequently to profit or loss 6(2) (15) –
Total items that may be reclassified subsequently to profit or loss (78) 154 35
Other comprehensive income/(loss) for the year, net of tax 235 (381) (763)
Total comprehensive income for the year 2,699 1,773 1,156
Attributable to:
Equity shareholders of the parent 2,711 1,772 1,154
Non-controlling interests (12) 1 2
2,699 1,773 1,156
1. See note 1 on page 92.
Unaudited commentary on consolidated statement of comprehensive income
The consolidated statement of comprehensive income
records certain items as prescribed by the accounting rules.
For us, the majority of the income or expense included here
relates to movements in actuarial assumptions on pension
schemes and the associated tax impact. These items are not
part of profit for the year, yet are important to allow the reader
to gain a more comprehensive picture of our performance as
awhole.
Remeasurements of net retirement benefit
obligations
We had a net gain after tax of £313m (2012/13: net cost of £535m)
on our pension and other post-employment benefit schemes
which is due to changes in key assumptions made in the valuation
calculation and differences to actual outcomes during the year.
Exchange adjustments
Adjustments are made when we translate the results and net
assets of our companies operating outside the UK, as well as
debt we have issued in foreign currencies. The net movement
forthe year resulted in a loss of £158m (2012/13: £117m gain).
Net gains/(losses) in respect of cash flow hedges
The value of derivatives held to hedge cash flows is impacted
bychanges in expected interest rates and exchange rates.
Thenet gain for the year was £63m (2012/13: £31m loss).
Consolidated statement
of comprehensive income
for the years ended 31 March
This unaudited commentary does not form part of the financial statements.
86 National Grid Annual Report and Accounts 2013/14