National Grid 2014 Annual Report Download - page 86
Download and view the complete annual report
Please find page 86 of the 2014 National Grid annual report below. You can navigate through the pages in the report by either clicking on the pages listed below, or by using the keyword search tool below to find specific information within the annual report.-
 1
1 -
2
-
3
-
4
-
5
-
6
-
7
-
8
-
9
-
10
-
11
-
12
-
13
-
14
-
15
-
16
-
17
-
18
-
19
-
20
-
21
-
22
-
23
-
24
-
25
-
26
-
27
-
28
-
29
-
30
-
31
-
32
-
33
-
34
-
35
-
36
-
37
-
38
-
39
-
40
-
41
-
42
-
43
-
44
-
45
-
46
-
47
-
48
-
49
-
50
-
51
-
52
-
53
-
54
-
55
-
56
-
57
-
58
-
59
-
60
-
61
-
62
-
63
-
64
-
65
-
66
-
67
-
68
-
69
-
70
-
71
-
72
-
73
-
74
-
75
-
 76
76 -
 77
77 -
 78
78 -
 79
79 -
 80
80 -
 81
81 -
 82
82 -
 83
83 -
 84
84 -
 85
85 -
 86
86 -
 87
87 -
 88
88 -
 89
89 -
 90
90 -
 91
91 -
 92
92 -
 93
93 -
 94
94 -
 95
95 -
 96
96 -
97
-
98
-
99
-
100
-
101
-
102
-
103
-
104
-
105
-
106
-
107
-
108
-
109
-
110
-
111
-
112
-
113
-
114
-
115
-
116
-
117
-
118
-
119
-
120
-
121
-
122
-
123
-
124
-
125
-
126
-
127
-
128
-
129
-
130
-
131
-
132
-
133
-
134
-
135
-
136
-
137
-
138
-
139
-
140
-
141
-
142
-
143
-
144
-
145
-
146
-
147
-
148
-
149
-
150
-
151
-
152
-
153
-
154
-
155
-
156
-
157
-
158
-
159
-
160
-
161
-
162
-
163
-
164
-
165
-
166
-
167
-
168
-
169
-
170
-
171
-
172
-
173
-
174
-
175
-
176
-
177
-
178
-
179
-
180
-
181
-
182
-
183
-
184
-
185
-
186
-
187
-
188
-
189
-
190
-
191
-
192
-
193
-
194
-
195
-
196
 |
 |

Notes
2014
£m
2014
£m
2013
(restated)1
£m
2013
(restated)1
£m
2012
(restated)1
£m
2012
(restated)1
£m
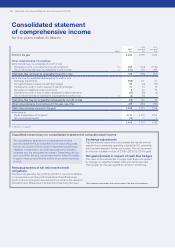
Revenue 2(a) 14,809 14,359 13,832
Operating costs 3(11,074) (10,610) (10,297)
Operating profit
Before exceptional items, remeasurements and stranded
cost recoveries 2(b) 3,664 3,639 3,491
Exceptional items, remeasurements and stranded cost
recoveries 471 110 44
Total operating profit 2(b) 3,735 3,749 3,535
Finance income 536 30 28
Finance costs
Before exceptional items and remeasurements 5(1,144) (1,154) (1,118)
Exceptional items and remeasurements 4,5 93 68 (70)
Total finance costs 5(1,051) (1,086) (1,188)
Share of post-tax results of joint ventures and associates 14 28 18 7
Profit before tax
Before exceptional items, remeasurements and stranded
cost recoveries 2(b) 2,584 2,533 2,408
Exceptional items, remeasurements and stranded cost
recoveries 4164 178 (26)
Total profit before tax 2(b) 2,748 2,711 2,382
Taxation
Before exceptional items, remeasurements and stranded
cost recoveries 6(581) (619) (697)
Exceptional items, remeasurements and stranded cost
recoveries 4,6 297 62 234
Total taxation 6(284) (557) (463)
Profit after tax
Before exceptional items, remeasurements and stranded
cost recoveries 2,003 1,914 1,711
Exceptional items, remeasurements and stranded cost
recoveries 4461 240 208
Profit for the year 2,464 2,154 1,919
Attributable to:
Equity shareholders of the parent 2,476 2,153 1,917
Non-controlling interests (12) 1 2
2,464 2,154 1,919
Earnings per share2
Basic 7(a) 66.4p 5 7. 8 p 51.6p
Diluted 7(b) 66.1p 5 7. 5 p 51.3p
1. See note 1 on page 92.
2. Comparative amounts have been restated to reflect the impact of additional shares issued as scrip dividends.
Consolidated
income statement
for the years ended 31 March
84 National Grid Annual Report and Accounts 2013/14