National Grid 2014 Annual Report Download - page 93
Download and view the complete annual report
Please find page 93 of the 2014 National Grid annual report below. You can navigate through the pages in the report by either clicking on the pages listed below, or by using the keyword search tool below to find specific information within the annual report.-
 1
1 -
2
-
3
-
4
-
5
-
6
-
7
-
8
-
9
-
10
-
11
-
12
-
13
-
14
-
15
-
16
-
17
-
18
-
19
-
20
-
21
-
22
-
23
-
24
-
25
-
26
-
27
-
28
-
29
-
30
-
31
-
32
-
33
-
34
-
35
-
36
-
37
-
38
-
39
-
40
-
41
-
42
-
43
-
44
-
45
-
46
-
47
-
48
-
49
-
50
-
51
-
52
-
53
-
54
-
55
-
56
-
57
-
58
-
59
-
60
-
61
-
62
-
63
-
64
-
65
-
66
-
67
-
68
-
69
-
70
-
71
-
72
-
73
-
74
-
75
-
76
-
77
-
78
-
79
-
80
-
81
-
82
-
 83
83 -
 84
84 -
 85
85 -
 86
86 -
 87
87 -
 88
88 -
 89
89 -
 90
90 -
 91
91 -
 92
92 -
 93
93 -
 94
94 -
 95
95 -
 96
96 -
 97
97 -
 98
98 -
 99
99 -
 100
100 -
 101
101 -
 102
102 -
 103
103 -
104
-
105
-
106
-
107
-
108
-
109
-
110
-
111
-
112
-
113
-
114
-
115
-
116
-
117
-
118
-
119
-
120
-
121
-
122
-
123
-
124
-
125
-
126
-
127
-
128
-
129
-
130
-
131
-
132
-
133
-
134
-
135
-
136
-
137
-
138
-
139
-
140
-
141
-
142
-
143
-
144
-
145
-
146
-
147
-
148
-
149
-
150
-
151
-
152
-
153
-
154
-
155
-
156
-
157
-
158
-
159
-
160
-
161
-
162
-
163
-
164
-
165
-
166
-
167
-
168
-
169
-
170
-
171
-
172
-
173
-
174
-
175
-
176
-
177
-
178
-
179
-
180
-
181
-
182
-
183
-
184
-
185
-
186
-
187
-
188
-
189
-
190
-
191
-
192
-
193
-
194
-
195
-
196
 |
 |

Strategic Report Corporate Governance Financial Statements Additional Information
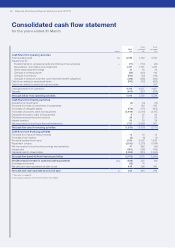
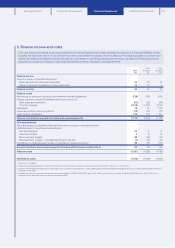
Unaudited commentary on consolidated cash flow statement
The consolidated cash flow statement shows how the cash
balance has moved during the year. Cash inflows and outflows
are presented to allow users to understand how they relate to
the day-to-day operations of the business (operating activities);
the money that has been spent or earned on assets in the
year, including acquisitions of physical assets or other
businesses (investing activities); and the cash raised from debt
or share issues and other loan borrowings or repayments
(financing activities).
Reconciliation of cash flow to net debt
2014
£m
2013
£m
Cash generated from operations 4,419 4,037
Net capital expenditure (3,119) (3,357)
Business net cash flow 1,300 680
Net interest paid (866) (763)
Tax paid (400) (287)
Net acquisitions and disposals (4) 169
Dividends paid (1,059) (810)
Other cash movements 47 34
Non-cash movements 1,221 (855)
Decrease/(increase) in net debt 239 (1,832)
Opening net debt (21,429) (19,597)
Closing net debt (21,190) (21,429)
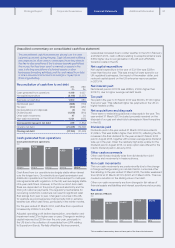
Cash generated from operations
4,372
4,854 4,487
2009/10 2010/11 2011/12 2012/13 2013/14
4,037 4,419
Cash generated from operations
£m
Cash flows from our operations are largely stable when viewed
over the longer term. Our electricity and gas transmission and
distribution operations in the UK and US are subject to multi-year
rate agreements with regulators. In the UK, we have largely stable
intra-year cash flows. However, in the US our short-term cash
flows are dependent on the price of gas and electricity and the
timing of customer payments. The regulatory mechanisms for
recovering costs from customers can result in significant cash
flow swings from year to year. Changes in volumes in the US,
forexample asa consequence ofabnormally mild or extreme
weather can affect cash flows, particularly in the winter months.
For the year ended 31 March 2014, cash flow from operations
increased by £382m to £4,419m.
Adjusted operating profit before depreciation, amortisation and
impairment was £81m higher year on year. Changes in working
capital improved by £351m over the prioryear, principally in
theUS due to the collection of receivables from LIPA relating
toSuperstorm Sandy. Partially offsetting this improvement,
receivables increased due to colder weather in theUS in February
and March 2014, cash outflows relating to exceptional items were
£38m higher due to reorganisation in theUK and LIPA MSA
transition costs in the US.
Net capital expenditure
Net capital expenditure in the year of £3,119m was £238m
lowerthan the prior year. This was a result of lower spend in our
UK regulated businesses, the impact of the weaker dollar, and
reduced capital spend on the US enterprise resource system
in2013/14.
Net interest paid
Net interest paid in 2013/14 was £866m, £103m higher than
2012/13, due to higher average netdebt levels.
Tax paid
Tax paid in the year to 31 March 2014 was £400m, £113m higher
than prior year. This reflected higher tax payments in the UK on
higher taxable profits.
Net acquisitions and disposals
There were no material acquisitions or disposals in the year. The
year ended 31 March 2013 included proceeds received on the
disposal of our gas and electricity businesses in New Hampshire
in the US.
Dividends paid
Dividends paid in the year ended 31 March 2014 amounted to
£1,059m. This was £249m higher than 2012/13, reflecting the 4%
increase in the final dividend for the year ended 31March 2013
paid in August 2013, together with a lower average scrip dividend
take-up in the year. Given the relatively high scrip uptake forthe
dividend paid in August 2013, no scrip option was offered for the
interim dividend paid in January 2014.
Other cash movements
Other cash flows principally arise from dividends from joint
ventures and movements in treasury shares.
Non-cash movements
The non-cash movements are predominantly due to the change
in foreign exchange arising on net debt held in currencies other
than sterling. In the year ended 31 March 2014, the dollar weakened
from $1.52 at 31 March 2013 to$1.67 at 31 March 2014. This has
caused a reduction in the sterling value of net debt.
Other non-cash movements are from changes in fair values of
financial assets and liabilities and interest accretions and accruals.
Net debt
22,139
18,731 19,597
2010 2011 2012 2013 2014
21,429 21,190
Net debt at 31 March
£m
This unaudited commentary does not form part of the financial statements.
91