National Grid 2014 Annual Report Download - page 112
Download and view the complete annual report
Please find page 112 of the 2014 National Grid annual report below. You can navigate through the pages in the report by either clicking on the pages listed below, or by using the keyword search tool below to find specific information within the annual report.-
 1
1 -
2
-
3
-
4
-
5
-
6
-
7
-
8
-
9
-
10
-
11
-
12
-
13
-
14
-
15
-
16
-
17
-
18
-
19
-
20
-
21
-
22
-
23
-
24
-
25
-
26
-
27
-
28
-
29
-
30
-
31
-
32
-
33
-
34
-
35
-
36
-
37
-
38
-
39
-
40
-
41
-
42
-
43
-
44
-
45
-
46
-
47
-
48
-
49
-
50
-
51
-
52
-
53
-
54
-
55
-
56
-
57
-
58
-
59
-
60
-
61
-
62
-
63
-
64
-
65
-
66
-
67
-
68
-
69
-
70
-
71
-
72
-
73
-
74
-
75
-
76
-
77
-
78
-
79
-
80
-
81
-
82
-
83
-
84
-
85
-
86
-
87
-
88
-
89
-
90
-
91
-
92
-
93
-
94
-
95
-
96
-
97
-
98
-
99
-
100
-
101
-
 102
102 -
 103
103 -
 104
104 -
 105
105 -
 106
106 -
 107
107 -
 108
108 -
 109
109 -
 110
110 -
 111
111 -
 112
112 -
 113
113 -
 114
114 -
 115
115 -
 116
116 -
 117
117 -
 118
118 -
 119
119 -
 120
120 -
 121
121 -
 122
122 -
123
-
124
-
125
-
126
-
127
-
128
-
129
-
130
-
131
-
132
-
133
-
134
-
135
-
136
-
137
-
138
-
139
-
140
-
141
-
142
-
143
-
144
-
145
-
146
-
147
-
148
-
149
-
150
-
151
-
152
-
153
-
154
-
155
-
156
-
157
-
158
-
159
-
160
-
161
-
162
-
163
-
164
-
165
-
166
-
167
-
168
-
169
-
170
-
171
-
172
-
173
-
174
-
175
-
176
-
177
-
178
-
179
-
180
-
181
-
182
-
183
-
184
-
185
-
186
-
187
-
188
-
189
-
190
-
191
-
192
-
193
-
194
-
195
-
196
 |
 |

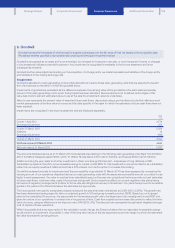
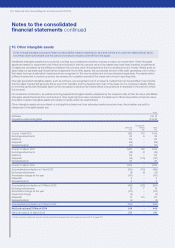
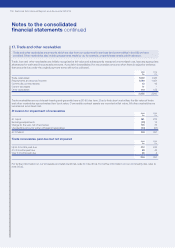
10. Other intangible assets
Other intangible assets includes software and acquisition-related assets (such as brand names and customer relationships), which
are written down (amortised) over the period we expect to receive a benefit from the asset.
Identifiable intangible assets are recorded at cost less accumulated amortisation and any provision for impairment. Other intangible
assets are tested for impairment only if there is an indication that the carrying value of the assets may have been impaired. Impairments
ofassets are calculated as the difference between the carrying value of the asset and the recoverable amount, if lower. Where such an
asset does not generate cash flows that are independent from other assets, the recoverable amount of the cash-generating unit to which
that asset belongs is estimated. Impairments are recognised in the income statement and are disclosed separately. Any assets which
suffered impairment in a previous period are reviewed for possible reversal of the impairment at each reporting date.
Internally generated intangible assets, such as software, are recognised only if: an asset is created that can be identified; it is probable
that the asset created will generate future economic benefits; and the development cost of the asset can be measured reliably. Where
no internally generated intangible asset can be recognised, development expenditure is recorded as an expense in the period in which
itis incurred.
On a business combination, as well as recording separable intangible assets possessed by the acquired entity at their fair value, identifiable
intangible assets that arise from contractual or other legal rights are also included in the statement of financial position at their fair value.
Acquisition-related intangible assets principally comprise customer relationships.
Other intangible assets are amortised on a straight-line basis over their estimated useful economic lives. Amortisation periods for
categories of intangible assets are:
Years
Software 3 to 10
Acquisition-related intangibles 10 to 25
Software
£m
Acquisition-
related
£m
Total
£m
Cost at 1 April 2012 899 116 1,015
Exchange adjustments 20 626
Additions 175 –175
Disposals (26) –(26)
Reclassifications1(37) –(37)
Cost at 31 March 2013 1,031 122 1,153
Exchange adjustments (38) (7) (45)
Additions 179 –179
Disposals (16) (115) (131)
Reclassifications166 –66
Cost at 31 March 2014 1,222 –1,222
Accumulated amortisation at 1 April 2012 (353) (116 ) (469)
Exchange adjustments (6) (6) (12)
Amortisation charge for the year (101) –(101)
Disposals 9 – 9
Reclassifications19 – 9
Accumulated amortisation at 31 March 2013 (442) (122) (564)
Exchange adjustments 12 719
Amortisation charge for the year (127) –(127)
Impairment charge (5) –(5)
Disposals 12 115 127
Reclassifications1(3) –(3)
Accumulated amortisation at 31 March 2014 (553) –(553)
Net book value at 31 March 2014 669 –669
Net book value at 31 March 2013 589 –589
1. Reclassifications represents amounts transferred (to)/from property, plant and equipment (see note 11 on page 112).
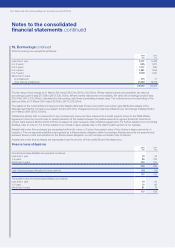
Notes to the consolidated
financial statements continued
110 National Grid Annual Report and Accounts 2013/14