National Grid 2014 Annual Report Download - page 109
Download and view the complete annual report
Please find page 109 of the 2014 National Grid annual report below. You can navigate through the pages in the report by either clicking on the pages listed below, or by using the keyword search tool below to find specific information within the annual report.-
 1
1 -
2
-
3
-
4
-
5
-
6
-
7
-
8
-
9
-
10
-
11
-
12
-
13
-
14
-
15
-
16
-
17
-
18
-
19
-
20
-
21
-
22
-
23
-
24
-
25
-
26
-
27
-
28
-
29
-
30
-
31
-
32
-
33
-
34
-
35
-
36
-
37
-
38
-
39
-
40
-
41
-
42
-
43
-
44
-
45
-
46
-
47
-
48
-
49
-
50
-
51
-
52
-
53
-
54
-
55
-
56
-
57
-
58
-
59
-
60
-
61
-
62
-
63
-
64
-
65
-
66
-
67
-
68
-
69
-
70
-
71
-
72
-
73
-
74
-
75
-
76
-
77
-
78
-
79
-
80
-
81
-
82
-
83
-
84
-
85
-
86
-
87
-
88
-
89
-
90
-
91
-
92
-
93
-
94
-
95
-
96
-
97
-
98
-
 99
99 -
 100
100 -
 101
101 -
 102
102 -
 103
103 -
 104
104 -
 105
105 -
 106
106 -
 107
107 -
 108
108 -
 109
109 -
 110
110 -
 111
111 -
 112
112 -
 113
113 -
 114
114 -
 115
115 -
 116
116 -
 117
117 -
 118
118 -
 119
119 -
120
-
121
-
122
-
123
-
124
-
125
-
126
-
127
-
128
-
129
-
130
-
131
-
132
-
133
-
134
-
135
-
136
-
137
-
138
-
139
-
140
-
141
-
142
-
143
-
144
-
145
-
146
-
147
-
148
-
149
-
150
-
151
-
152
-
153
-
154
-
155
-
156
-
157
-
158
-
159
-
160
-
161
-
162
-
163
-
164
-
165
-
166
-
167
-
168
-
169
-
170
-
171
-
172
-
173
-
174
-
175
-
176
-
177
-
178
-
179
-
180
-
181
-
182
-
183
-
184
-
185
-
186
-
187
-
188
-
189
-
190
-
191
-
192
-
193
-
194
-
195
-
196
 |
 |

Strategic Report Corporate Governance Financial Statements Additional Information
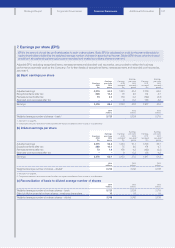
7. Earnings per share (EPS)
EPS is the amount of post-tax profit attributable to each ordinary share. Basic EPS is calculated on profit for theyear attributable to
equity shareholders divided by the weighted average number of shares in issue during the year. Diluted EPS shows what the impact
would be if all outstanding share options were exercised and treated as ordinary shares at year end.
Adjusted EPS, excluding exceptional items, remeasurements and stranded cost recoveries, are provided to reflect the business
performance subtotals used by the Company. For further details of exceptional items, remeasurements and stranded cost recoveries,
see note 4.
(a) Basic earnings per share
Earnings
2014
£m
Earnings
per share
2014
pence
Earnings
2013
(restated)1
£m
Earnings
per share
2013
(restated)1,2
pence
Earnings
2012
(restated)1
£m
Earnings
per share
2012
(restated)1,2
pence
Adjusted earnings 2,015 54.0 1,913 51.4 1,709 46.0
Exceptional items after tax 388 10.4 75 2.0 174 4.7
Remeasurements after tax 73 2.0 156 4.2 (122) (3.3)
Stranded cost recoveries after tax – – 90.2 156 4.2
Earnings 2,476 66.4 2,15 3 57. 8 1,917 51.6
2014
millions
2013
millions
2012
millions
Weighted average number of shares – basic23,729 3,724 3,719
1. See note 1 on page 92.
2. Comparative amounts have been restated to reflect the impact of additional shares issued as scrip dividends.
(b) Diluted earnings per share
Earnings
2014
£m
Earnings
per share
2014
pence
Earnings
2013
(restated)1
£m
Earnings
per share
2013
(restated)1,2
pence
Earnings
2012
(restated)1
£m
Earnings
per share
2012
(restated)1,2
pence
Adjusted earnings 2,015 53.8 1,913 51.1 1,709 45.7
Exceptional items after tax 388 10.4 75 2.0 174 4.7
Remeasurements after tax 73 1.9 156 4.2 (122) (3.3)
Stranded cost recoveries after tax – – 90.2 156 4.2
Earnings 2,476 66.1 2,153 57.5 1,917 51.3
2014
millions
2013
millions
2012
millions
Weighted average number of shares – diluted23,748 3,742 3,738
1. See note 1 on page 92.
2. Comparative amounts have been restated to reflect the impact of additional shares issued as scrip dividends.
(c) Reconciliation of basic to diluted average number of shares
2014
millions
2013
millions
2012
millions
Weighted average number of ordinary shares – basic 3,729 3,724 3,719
Effect of dilutive potential ordinary shares – employee share plans 19 18 19
Weighted average number of ordinary shares – diluted 3,748 3,742 3,738
107