National Grid 2014 Annual Report Download - page 186
Download and view the complete annual report
Please find page 186 of the 2014 National Grid annual report below. You can navigate through the pages in the report by either clicking on the pages listed below, or by using the keyword search tool below to find specific information within the annual report.-
 1
1 -
2
-
3
-
4
-
5
-
6
-
7
-
8
-
9
-
10
-
11
-
12
-
13
-
14
-
15
-
16
-
17
-
18
-
19
-
20
-
21
-
22
-
23
-
24
-
25
-
26
-
27
-
28
-
29
-
30
-
31
-
32
-
33
-
34
-
35
-
36
-
37
-
38
-
39
-
40
-
41
-
42
-
43
-
44
-
45
-
46
-
47
-
48
-
49
-
50
-
51
-
52
-
53
-
54
-
55
-
56
-
57
-
58
-
59
-
60
-
61
-
62
-
63
-
64
-
65
-
66
-
67
-
68
-
69
-
70
-
71
-
72
-
73
-
74
-
75
-
76
-
77
-
78
-
79
-
80
-
81
-
82
-
83
-
84
-
85
-
86
-
87
-
88
-
89
-
90
-
91
-
92
-
93
-
94
-
95
-
96
-
97
-
98
-
99
-
100
-
101
-
102
-
103
-
104
-
105
-
106
-
107
-
108
-
109
-
110
-
111
-
112
-
113
-
114
-
115
-
116
-
117
-
118
-
119
-
120
-
121
-
122
-
123
-
124
-
125
-
126
-
127
-
128
-
129
-
130
-
131
-
132
-
133
-
134
-
135
-
136
-
137
-
138
-
139
-
140
-
141
-
142
-
143
-
144
-
145
-
146
-
147
-
148
-
149
-
150
-
151
-
152
-
153
-
154
-
155
-
156
-
157
-
158
-
159
-
160
-
161
-
162
-
163
-
164
-
165
-
166
-
167
-
168
-
169
-
170
-
171
-
172
-
173
-
174
-
175
-
 176
176 -
 177
177 -
 178
178 -
 179
179 -
 180
180 -
 181
181 -
 182
182 -
 183
183 -
 184
184 -
 185
185 -
 186
186 -
 187
187 -
 188
188 -
 189
189 -
 190
190 -
 191
191 -
 192
192 -
 193
193 -
 194
194 -
 195
195 -
 196
196
 |
 |

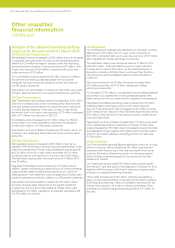
US Regulated
Our US Regulated business was affected by a reduction in timing
differences of £37 million due to in year under-recoveries of
£20million compared with a prior year over-recovery of £17 million
(after adjusting for foreign exchange movements).
The estimated closing over-recovered value at 31 March 2013
was£110 million. This was offset by a year-on-year reduction
inmajor storm costs of £33 million, as the financial impact of
Superstorm Sandy and Storm Nemo was lower than that from
Hurricane Irene and the Massachusetts October snowstorm
in2011/12.
Net costs incurred in the US after insurance proceeds were
£33million lower than 2011/12 (after adjusting for foreign
exchangemovements).
An increase of £135 million in net regulated income reflects deferral
recoveries in our upstate New York businesses together with
higher revenues from our capital tracker regulatory arrangements.
Regulated controllable operating costs increased by £19 million
reflecting inflation and higher spend on IS outsourcing and
security. Post-retirement costs increased by £29 million primarily
due to reductions in discount rates. Bad debt expense reduced by
£33 million in the year due to improving economic conditions and
improved collections.
Depreciation and amortisation increased by £17 million as a result
of our capital expenditure programme in the year. Finally, other
costs increased by £58 million due to increased property tax rates
and assessed values, together with higher environmental costs in
2012/13. As a result, adjusted operating profit for the year was
£1,254 million.
Other activities
Our Other activities were significantly affected by the cost of major
storms in the year, with an additional £51 million cost incurred
compared with the prior year. This was as a result of insurance
costs for Superstorm Sandy incurred in our insurance captive.
Some of these costs are expected to be recovered from the
reinsurance market.
Our metering business made £24 million lower operating profit
than the prior year as a result of the disposal of OnStream in 2012,
together with the impact of third-party disputes on legacy meter
pricing in our regulated metering business.
Other costs increased by £126 million, primarily representing
spend on the implementation of the new US information systems
and financial procedures, offset by increased revenues from the
French interconnector. As a result of these movements, Other
activities recorded an adjusted operating profit of £11 million for
theyear.
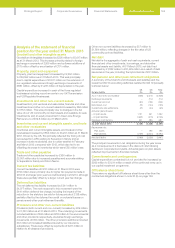
Analysis of the adjusted operating profit by
segment for the year ended 31 March 2013
UK Electricity Transmission
Net regulated revenue increased by £235 million due to an increase
in regulated revenues under UK price control allowances partly
offset by a £10 million increase in charges under the balancing
services incentive scheme. Timing increased by £67 million, with
inyear over-recovery of £29 million compared with a prior year
under-recovery of £38 million.
Our controllable costs increased by £8 million driven by inflation,
recruitment and training costs associated with our capital
investment programme and increases in contribution rates for
ourDB pension schemes.
Depreciation and amortisation increased by £42 million as a result
ofhigher asset values due to our capital investment programme.
UK Gas Transmission
Gas Transmission net regulated revenue increased by £112 million
driven by increased price control revenues partly offset by lower
incentive scheme performance and reduced auction revenues in
our LNG storage business. There was no year-on-year timing
movement due to an in year over-recovery of £17 million compared
with a £17 million over-recovery in 2012/13.
Controllable costs increased by £21 million driven by inflation,
anincrease in our environmental provisions and increases in
contribution rates for our DB pension schemes.
Depreciation and amortisation increased by £16 million due to an
increase in the underlying asset base and some one-time asset
write-offs.
UK Gas Distribution
Net regulated revenue increased by £85 million driven by our
regulatory RPI-X pricing formula and improved performance under
incentive programmes. Timing reduced adjusted operating profit
by £32 million driven by in year under-recoveries of £10 million
compared with an over-recovery in the prior year of £22 million.
The estimated closing under-recovered value at 31 March 2013
was£8 million.
Regulated controllable costs increased by £13 million due to:
inflation, system maintenance costs and one-off contract strategy
costs, partially offset by efficiencies enabled by our new front
office systems. Post-retirement costs increased by £2 million as a
result of increased contribution rates for our DB pension schemes.
Depreciation and amortisation increased by £10 million driven
byhigher average asset values due to the capital investment
programme and new front office systems. Finally, other costs
decreased by £3 million, resulting in an adjusted operating profit
of£794 million for the year.
Other unaudited
financial information
continued
184 National Grid Annual Report and Accounts 2013/14