National Grid 2014 Annual Report Download - page 98
Download and view the complete annual report
Please find page 98 of the 2014 National Grid annual report below. You can navigate through the pages in the report by either clicking on the pages listed below, or by using the keyword search tool below to find specific information within the annual report.-
 1
1 -
2
-
3
-
4
-
5
-
6
-
7
-
8
-
9
-
10
-
11
-
12
-
13
-
14
-
15
-
16
-
17
-
18
-
19
-
20
-
21
-
22
-
23
-
24
-
25
-
26
-
27
-
28
-
29
-
30
-
31
-
32
-
33
-
34
-
35
-
36
-
37
-
38
-
39
-
40
-
41
-
42
-
43
-
44
-
45
-
46
-
47
-
48
-
49
-
50
-
51
-
52
-
53
-
54
-
55
-
56
-
57
-
58
-
59
-
60
-
61
-
62
-
63
-
64
-
65
-
66
-
67
-
68
-
69
-
70
-
71
-
72
-
73
-
74
-
75
-
76
-
77
-
78
-
79
-
80
-
81
-
82
-
83
-
84
-
85
-
86
-
87
-
 88
88 -
 89
89 -
 90
90 -
 91
91 -
 92
92 -
 93
93 -
 94
94 -
 95
95 -
 96
96 -
 97
97 -
 98
98 -
 99
99 -
 100
100 -
 101
101 -
 102
102 -
 103
103 -
 104
104 -
 105
105 -
 106
106 -
 107
107 -
 108
108 -
109
-
110
-
111
-
112
-
113
-
114
-
115
-
116
-
117
-
118
-
119
-
120
-
121
-
122
-
123
-
124
-
125
-
126
-
127
-
128
-
129
-
130
-
131
-
132
-
133
-
134
-
135
-
136
-
137
-
138
-
139
-
140
-
141
-
142
-
143
-
144
-
145
-
146
-
147
-
148
-
149
-
150
-
151
-
152
-
153
-
154
-
155
-
156
-
157
-
158
-
159
-
160
-
161
-
162
-
163
-
164
-
165
-
166
-
167
-
168
-
169
-
170
-
171
-
172
-
173
-
174
-
175
-
176
-
177
-
178
-
179
-
180
-
181
-
182
-
183
-
184
-
185
-
186
-
187
-
188
-
189
-
190
-
191
-
192
-
193
-
194
-
195
-
196
 |
 |

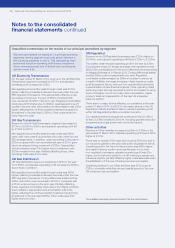
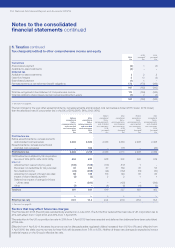
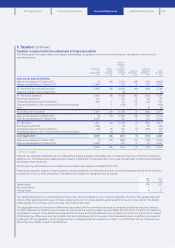
Notes to the consolidated
financial statements continued
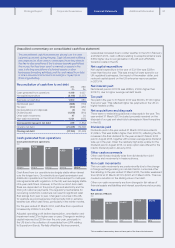
Unaudited commentary on the results of our principal operations by segment
We have summarised the results of our principal operating
segments here by segment to provide direct reference to
theresults as disclosed in note 2. This analysis has been
performed based on operating profit before exceptional
items, remeasurements and stranded cost recoveries as
setout in note 2 (b).
UK Electricity Transmission
For the year ended 31 March 2014, revenue in the UK Electricity
Transmission segment increased by £277m, and adjusted
operating profit increased by £38m.
Net regulated income after pass-through costs was £170m
higher, reflecting increases in allowed revenues under the new
RIIO regulatory framework. This was partially offset by under-
recoveries of revenue in the year of £60m compared with
over-recoveries of £29m in the prior year. Regulated controllable
costs were £27m higher due to inflation, legal fees and one-off
credits in theprior year. Depreciation and amortisation was £20m
higherreflecting the continued capital investment programme
(investment in the year was £1,381m). Other costs were £4m
lower than prior year.
UK Gas Transmission
Revenue in the UK Gas Transmission segment decreased by
£177m in 2013/14 to £941m and adjusted operating profit fell
by£114m to £417m.
Net regulated income after pass-through costs was £80m
lower,with lower permit income than prior year under the new
RIIO arrangements. In addition, under-recoveries in the year of
£21m compared with over-recoveries last year of £17m, gave
riseto an adverse timing movement of £38m. Depreciation
andamortisation was £10m higher due to investment, with
£181minvested in the year. Partially offsetting these, other
operating costs were £14m lower.
UK Gas Distribution
UK Gas Distribution revenue increased by £184m in the year
to£1,898m, and adjusted operating profit increased to £904m
from £794m in 2012/13.
Net regulated income after pass-through costs was £96m
higher,reflecting increases in allowed revenues under the new
RIIO regulatory framework. Timing differences added another
£39m, with £29m over-recoveries in 2013/14, compared with
a£10m under-recovery in the prior year. Partially offsetting
these,regulated controllable costs were £14m higher primarily
due to inflation. Depreciation and amortisation was £10m
higherreflecting the continued capital investment programme
(investment in the year was £480m). Other costs were £1m
higherthan prior year.
US Regulated
Revenue in our US Regulated businesses was £122m higher at
£8,040m, and adjusted operating profit fell by £129m to £1,125m.
The weaker dollar reduced operating profit in the year by £38m.
Excluding the impact of foreign exchange, net regulated income
fell by £52m, principally due to the end of deferral income recoveries
for Niagara Mohawk at 31 March 2013. Timing differences added
another £29m profit compared with prior year. Regulated
controllable costs increased by £89m at constant currency as
aresult of inflation and wage increases, higher insurance costs
post Superstorm Sandy, and cost true-ups identified during the
implementation of new financial systems. Other operating costs
(excluding major storms) increased by £61m at constant currency
due to the higher cost of non-major storm remediation, higher
property taxes and depreciation of the new US enterprise
resource system.
There were no major storms affecting our operations in the year
ended 31 March 2014. In 2012/13, two major storms in the US,
Superstorm Sandy and Storm Nemo, reduced operating profit
within US Regulated by£82m at constant currency.
Our capital investment programme continues in the US, with a
further £1,219m invested in 2013/14, including gas leak reduction
programmes and gas growth and connection spend.
Other activities
Revenue in Other activities increased by £58m to £736m in the
year ended 31 March 2014. Adjusted operating profit was £120m
higher at £131m.
There was no repeat of the major storm cost of £51m incurred in
our insurance captive in the prior year due to Superstorm Sandy.
Operating profit in the French interconnector was £62m higher
asa result of strong auction revenues this year. In our other
non-regulated businesses, adjusted operating profit was £7m
higher due to improved results in our UK metering business and
insurance captive, partially offset by higher costs associated with
the stabilisation of the new US enterprise resource system.
Capital expenditure in our Other activities was £37m lower at
£180m, principally reflecting reduced capital spend on the new
US enterprise resource system.
This unaudited commentary does not form part of the financial statements.
96 National Grid Annual Report and Accounts 2013/14