National Grid 2014 Annual Report Download - page 9
Download and view the complete annual report
Please find page 9 of the 2014 National Grid annual report below. You can navigate through the pages in the report by either clicking on the pages listed below, or by using the keyword search tool below to find specific information within the annual report.-
 1
1 -
 2
2 -
 3
3 -
 4
4 -
 5
5 -
 6
6 -
 7
7 -
 8
8 -
 9
9 -
 10
10 -
 11
11 -
 12
12 -
 13
13 -
 14
14 -
 15
15 -
 16
16 -
 17
17 -
 18
18 -
 19
19 -
 20
20 -
21
-
22
-
23
-
24
-
25
-
26
-
27
-
28
-
29
-
30
-
31
-
32
-
33
-
34
-
35
-
36
-
37
-
38
-
39
-
40
-
41
-
42
-
43
-
44
-
45
-
46
-
47
-
48
-
49
-
50
-
51
-
52
-
53
-
54
-
55
-
56
-
57
-
58
-
59
-
60
-
61
-
62
-
63
-
64
-
65
-
66
-
67
-
68
-
69
-
70
-
71
-
72
-
73
-
74
-
75
-
76
-
77
-
78
-
79
-
80
-
81
-
82
-
83
-
84
-
85
-
86
-
87
-
88
-
89
-
90
-
91
-
92
-
93
-
94
-
95
-
96
-
97
-
98
-
99
-
100
-
101
-
102
-
103
-
104
-
105
-
106
-
107
-
108
-
109
-
110
-
111
-
112
-
113
-
114
-
115
-
116
-
117
-
118
-
119
-
120
-
121
-
122
-
123
-
124
-
125
-
126
-
127
-
128
-
129
-
130
-
131
-
132
-
133
-
134
-
135
-
136
-
137
-
138
-
139
-
140
-
141
-
142
-
143
-
144
-
145
-
146
-
147
-
148
-
149
-
150
-
151
-
152
-
153
-
154
-
155
-
156
-
157
-
158
-
159
-
160
-
161
-
162
-
163
-
164
-
165
-
166
-
167
-
168
-
169
-
170
-
171
-
172
-
173
-
174
-
175
-
176
-
177
-
178
-
179
-
180
-
181
-
182
-
183
-
184
-
185
-
186
-
187
-
188
-
189
-
190
-
191
-
192
-
193
-
194
-
195
-
196
 |
 |
Strategic Report Corporate Governance Financial Statements Additional Information
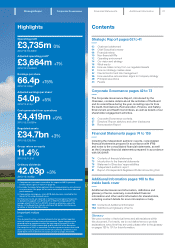
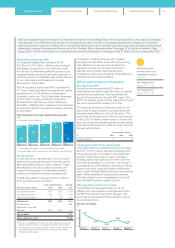
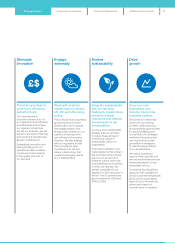
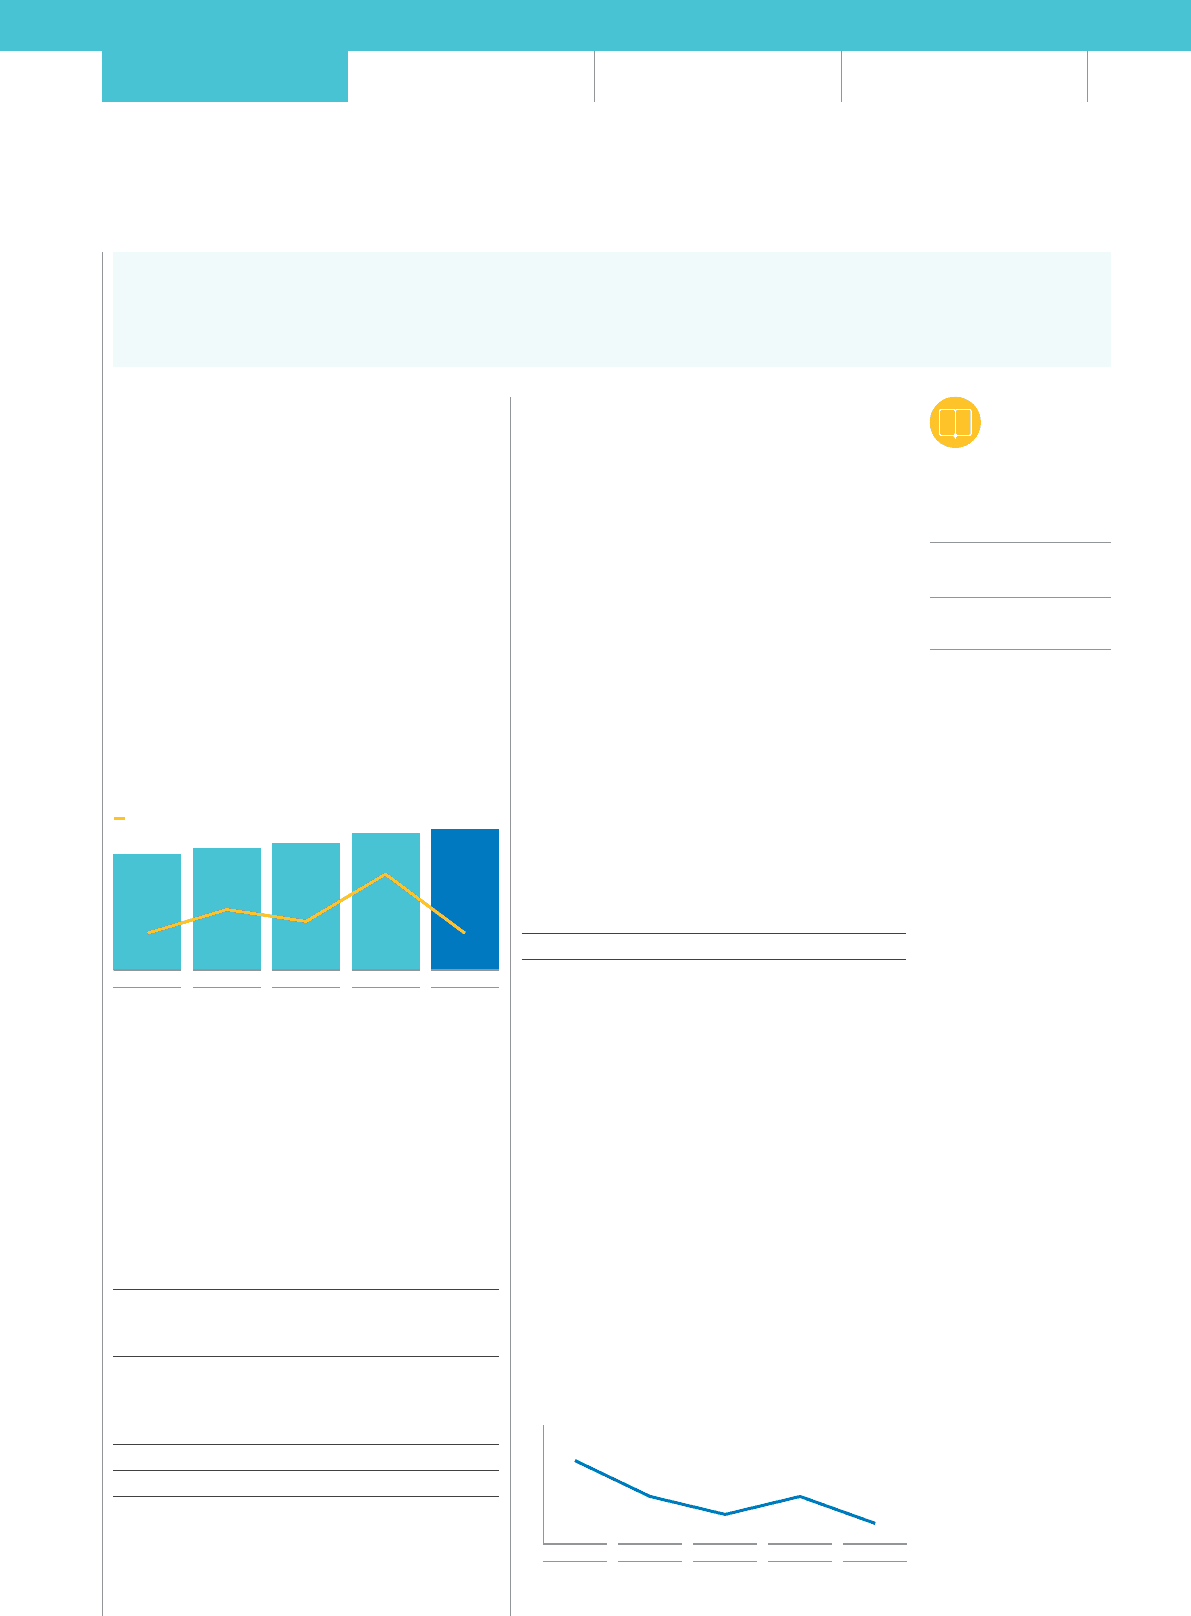
Regulated asset growth
Our regulated assets have increased by 3%
(£1billion) to £34.7 billion, reflecting the continued
high levels of investment in our networks in both
theUK and US. Maintaining efficient growth in our
regulated assets ensures we are well positioned to
continue providing consistently high levels of service
to our customers and increases our revenue
allowances in future years.
The UK regulatory asset value (RAV) increased by
£1.1 billion, reflecting inflation and significant capital
expenditure in our UKElectricity Transmission
business in particular. The US rate base decreased
by £0.1 billion. Foreign exchange movements
decreased the rate base reported in sterling by
£0.9billion. Offsetting this, investment in the networks
and working capital movements increased rate base
by £0.8 billion.
Total regulated assets andregulated asset growth
£bn
28.6129.9131.2 33.7 34.72
2010 2011 2012 2013 2014
5%
4%
8%
3%
3%
Regulated asset growth
1. US rate base calculated as at 31 December for these years.
2. Estimated figure until the conclusion of the regulatory reporting cycle.
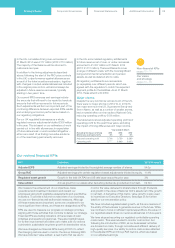
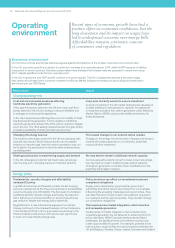
Value added
Our dividend is an important part of our returns to
shareholders along with growth in the value of the
asset base attributable to equity investors. These
are reflected in the value added metric that will
underpin our approach to sustainable decision
making and long-term incentive arrangements.
Overall value added in the year was £2.1 billion or
57.2p per share as set out below:
Year ended 31 March Change
£bn at constant currency 2014 2013 £bn
UK regulated assets125.2 24.3 +0.9
US regulated assets211. 2 10.3 +0.9
Other invested capital 1.7 1.5 +0.2
Total assets 38.1 36.1 +2.0
Dividend paid +1.1
Movement in goodwill –
Net debt (21.2) (20.2) -1.0
Value added +2.1
Value added per share 57. 2p
1. Consists of regulated asset values and other regulatory assets and
liabilities of the UK businesses regulated under RIIO price controls.
2. US regulated assets increased from $17.2 billion to $18.7 billion in the
year. These represent rate base plus assets outside of rate base,
including working capital.
The Board is confident that growth in assets,
earnings and cash flows, supported by improving
cash efficiency and an exposure to attractive
regulatory markets, should help the Group to
maintain strong, stable credit ratings and a
consistent prudent level of gearing, while delivering
attractive returns for shareholders.
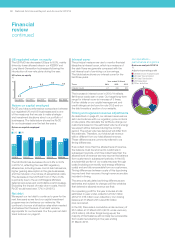
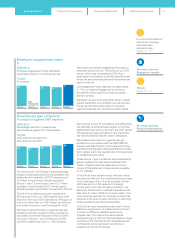
Other performance measures
Dividend growth
During the year we generated £1.3 billion of
sustainable business net cash flow after our capital
expenditure programmes. This has enabled the
growth of the dividend in line with RPI, being 2.9%
(2012/13: dividend growth of 4%), taking into account
the recommended final dividend of 27.54p.
The high level of take-up of this scrip option in the
last couple of years has led to concerns about the
potential dilutive effect on value of this option. This
meant that we decided not to offer the scrip element
for the 2013/14 interim dividend paid in January this
year, as our forecast capital programme was already
fully funded. We continue tooffer the scrip option for
the year-end dividend.
Year ended 31 March
%2014 2013 2012
Dividend growth 3 4 8
Cash generated from operations
Cash generated from operations was £4,419 million
(2012/13: £4,037 million). Adjusted operating profit
before depreciation, amortisation and impairment
was £81million higher year on year. Changes in
working capital improved by £351million over the
prior year, principally in the US due to the timing of
receivables from LIPA relating to Superstorm Sandy,
higher commodity costs and weather differences
year on year. Partially offsetting these improvements,
cash outflows relating to exceptional items were
£38million higher due to reorganisation in the UK
and LIPA MSA transition costs in the US.
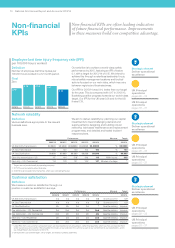
UK regulated return on equity
The UK RoE has decreased 90bps to 12.7%,
reflecting the new regulatory arrangements under
the RIIO framework in place from this year. This
performance represents 260bps outperformance
over allowed returns.
UK return on equity
%
12
14
16
2009/10 2010/11 2011/12 2012/13 2013/14
14.8
13.6
13.0
13.6
12.7
We have changed the way we present our financial information in the Strategic Report to remove duplication. As a result, the analysis
here focuses on our KPIs and other performance measures we use to monitor our business performance. Analysis of our financial
performance and position at 31 March 2014, including the performance of our principal operations, has been relocated to the financial
statements, however this analysis still forms part of our Strategic Report financial review. See page 75 for further information. See
pages 183 to 185 for commentary on our financial performance and position for the year ended 31 March 2013 compared with 2012.
How we make
moneyfrom our
regulated assets
page 20
UK regulation
pages 160 – 162
US regulation
pages 162 – 165
07