National Grid 2014 Annual Report Download - page 185
Download and view the complete annual report
Please find page 185 of the 2014 National Grid annual report below. You can navigate through the pages in the report by either clicking on the pages listed below, or by using the keyword search tool below to find specific information within the annual report.-
 1
1 -
2
-
3
-
4
-
5
-
6
-
7
-
8
-
9
-
10
-
11
-
12
-
13
-
14
-
15
-
16
-
17
-
18
-
19
-
20
-
21
-
22
-
23
-
24
-
25
-
26
-
27
-
28
-
29
-
30
-
31
-
32
-
33
-
34
-
35
-
36
-
37
-
38
-
39
-
40
-
41
-
42
-
43
-
44
-
45
-
46
-
47
-
48
-
49
-
50
-
51
-
52
-
53
-
54
-
55
-
56
-
57
-
58
-
59
-
60
-
61
-
62
-
63
-
64
-
65
-
66
-
67
-
68
-
69
-
70
-
71
-
72
-
73
-
74
-
75
-
76
-
77
-
78
-
79
-
80
-
81
-
82
-
83
-
84
-
85
-
86
-
87
-
88
-
89
-
90
-
91
-
92
-
93
-
94
-
95
-
96
-
97
-
98
-
99
-
100
-
101
-
102
-
103
-
104
-
105
-
106
-
107
-
108
-
109
-
110
-
111
-
112
-
113
-
114
-
115
-
116
-
117
-
118
-
119
-
120
-
121
-
122
-
123
-
124
-
125
-
126
-
127
-
128
-
129
-
130
-
131
-
132
-
133
-
134
-
135
-
136
-
137
-
138
-
139
-
140
-
141
-
142
-
143
-
144
-
145
-
146
-
147
-
148
-
149
-
150
-
151
-
152
-
153
-
154
-
155
-
156
-
157
-
158
-
159
-
160
-
161
-
162
-
163
-
164
-
165
-
166
-
167
-
168
-
169
-
170
-
171
-
172
-
173
-
174
-
 175
175 -
 176
176 -
 177
177 -
 178
178 -
 179
179 -
 180
180 -
 181
181 -
 182
182 -
 183
183 -
 184
184 -
 185
185 -
 186
186 -
 187
187 -
 188
188 -
 189
189 -
 190
190 -
 191
191 -
 192
192 -
 193
193 -
 194
194 -
 195
195 -
196
 |
 |

Strategic Report Corporate Governance Financial Statements Additional Information
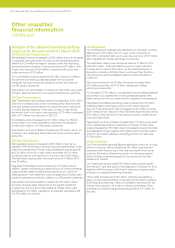
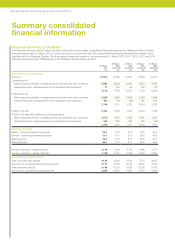
Analysis of the income statement for
theyears ended 31 March 2013 and
31March 2012
Revenue
Revenue for the year ended 31 March 2013 increased by
£527million to £14,359 million driven by the UK ET business,
which increased by £300 million principally due to inflationary
increases inallowable revenue and higher pass-through costs.
The UK GD segment also delivered an additional £114 million
primarily for the same reason. Finally, USRegulated revenue was
£123 million higher due to the recoveryof Niagara Mohawk
deferral revenues and higher FERCrate bases.
For the year ended 31 March 2012, revenue decreased £511 million
compared with the year ended 31 March 2011 to £13,832 million.
Increased UK ET revenue of £275 million under the regulatory
RPI-X pricing formula was offset by reduced US revenues as a
result of warmer winter weather leading to lower gas and electricity
volumes supplied.
Operating costs
Operating costs for the year ended 31 March 2013 of £10,610 million
were £313 million (3%) higher than prior year. The increase in costs
was predominantly due to increases in pass-through costs due
tothe colder winter in the US and inflationary increases in our
controllable costs. Additional costs of £91 million were incurred
inthe stabilisation of our new US enterprise resource system.
Exceptional items included in operating profit of £110 million in
2012/13 consisted of restructuring costs of £87 million, less a gain
on sale of our EnergyNorth gas business and Granite State
electricity business in New Hampshire of £3 million. There were
also gains of £180 million on commodity contract remeasurements.
Operating costs for the year ended 31 March 2012 of £10,297 million
were £320 million (3%) lower than the prior year. This was primarily
due to adverse timing differences of £256 million and higher storm
costs in the US of £116 million due to Tropical Storm Irene and the
October snowstorm in Massachusetts. Other operating costs
were relatively flat year on year, reflecting reduced costs in our US
Regulated segment as a result of the restructuring, offset by higher
costs within the UK due to inflation and additional employment
costs to support both the GDFO system implementation in our UK
GD business and the ongoing increase in our capital investment
programme in UK ET.
Exceptional items included in operating profit of £44 million in
2011/12 consisted of restructuring charges of £101 million,
environmental charges of £55 million, impairment charges of
£64million and commodity contract remeasurements of £94 million.
These were offset by net gains on disposals of subsidiaries of
£97million and stranded cost recoveries of £260 million.
In 2012/13, two major storms in the US, Superstorm Sandy and
Storm Nemo, had a material effect on the results of National Grid.
These two major storms reduced operating profit by £136 million.
In 2011/12, results were also affected by two major storm events,
Tropical Storm Irene and the October snowstorm in Massachusetts,
which reduced operating profit by £116 million. Adjusted operating
profit excluding the impact of timing differences and major storms
was £3,759 million in 2012/13 (2011/12: £3,589 million). Operating
profit including the impact of timing differences and major storms
was £3,869 million in 2012/13 (2011/12: £3,633 million).
Total finance costs
Total finance costs for the year ended 31 March 2013 were slightly
down compared with 2012 at £1,086 million, due to the reduction
in the cost of our index-linked debt, offset by the cost of carrying
higher debt levels and loss on disposal of financial instruments.
For the year ended 31 March 2012, total finance costs were
£1,188million, down 11% on the prior year primarily due to lower
interest rates on short-term instruments; lower debt repurchase
costs that had peaked in the prior year due to the use of surplus
funds from the rights issue; the benefit of lower average net debt
as a result of those buy backs; and a favourable variance in
pension interest primarily due to a higher than expected rate
ofreturn on US pension assets.
Financial remeasurements relate to net gains and losses on
derivative financial instruments. The year ended 31 March 2013
included a gain of £68 million (2011/12: £70 million loss).
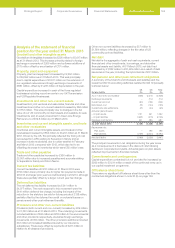
Taxation
For the year ended 31 March 2013, our adjusted tax charge
was£78 million lower than 2011/12, mainly due to changes in
taxprovisions in respect of prior years and a 2% decrease in
theUK statutory corporation tax rate in the year, partially offset
byincreased taxes on higher taxable profits. As a result of this,
oureffective tax rate for 2012/13 was 24.4% (2011/12: 28.9%).
The 2011/12 effective tax rate before exceptional items,
remeasurements and stranded cost recoveries did not change
from 2010/11 because a fall in prior period tax credits was offset,
primarily by a 2% reduction in the UK corporation tax rate and a
change in the UK/US profit mix where higher UK profits were
taxed at UK tax rates, which are lower than those in the US.
Exceptional tax from 2012/13 included an exceptional deferred tax
credit of £128 million arising from a reduction in the UK corporation
tax rate from 24% to 23% applicable from 1 April 2013. A similar
reduction in the UK corporation tax rate in 2011/12 from 26% to
24% resulted in a deferred tax credit of £242 million.
Adjusted earnings and EPS
As a result of the variances described above, adjusted earnings
forthe year ended 31 March 2013 was £1,913 million. For the year
ended 31 March 2012, adjusted earnings was £1,709 million.
The above earnings performance translated into adjusted
EPSgrowth in 2012/13 of 5.4 pence (12%). For the year ended
31March 2012, adjusted EPS growth was 0.6 pence (1%).
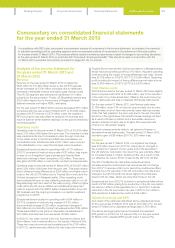
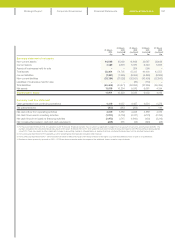
Commentary on consolidated financial statements
fortheyear ended 31 March 2013
In compliance with SEC rules, we present a summarised analysis of movements in the income statement, an analysis of movements
in adjusted operating profit by operating segment and a summarised analysis of movements in the statement of financial position
forthe year ended 31 March 2013. This analysis reflects restated numbers presented as a result of changes to accounting standards
in the year ended 31 March 2014, in particular IAS 19 (revised) ‘Employee benefits’. This should be read in conjunction with the
31March 2014 unaudited commentary included on pages 85, 89, 91 and 96.
183