National Grid 2014 Annual Report Download - page 184
Download and view the complete annual report
Please find page 184 of the 2014 National Grid annual report below. You can navigate through the pages in the report by either clicking on the pages listed below, or by using the keyword search tool below to find specific information within the annual report.-
 1
1 -
2
-
3
-
4
-
5
-
6
-
7
-
8
-
9
-
10
-
11
-
12
-
13
-
14
-
15
-
16
-
17
-
18
-
19
-
20
-
21
-
22
-
23
-
24
-
25
-
26
-
27
-
28
-
29
-
30
-
31
-
32
-
33
-
34
-
35
-
36
-
37
-
38
-
39
-
40
-
41
-
42
-
43
-
44
-
45
-
46
-
47
-
48
-
49
-
50
-
51
-
52
-
53
-
54
-
55
-
56
-
57
-
58
-
59
-
60
-
61
-
62
-
63
-
64
-
65
-
66
-
67
-
68
-
69
-
70
-
71
-
72
-
73
-
74
-
75
-
76
-
77
-
78
-
79
-
80
-
81
-
82
-
83
-
84
-
85
-
86
-
87
-
88
-
89
-
90
-
91
-
92
-
93
-
94
-
95
-
96
-
97
-
98
-
99
-
100
-
101
-
102
-
103
-
104
-
105
-
106
-
107
-
108
-
109
-
110
-
111
-
112
-
113
-
114
-
115
-
116
-
117
-
118
-
119
-
120
-
121
-
122
-
123
-
124
-
125
-
126
-
127
-
128
-
129
-
130
-
131
-
132
-
133
-
134
-
135
-
136
-
137
-
138
-
139
-
140
-
141
-
142
-
143
-
144
-
145
-
146
-
147
-
148
-
149
-
150
-
151
-
152
-
153
-
154
-
155
-
156
-
157
-
158
-
159
-
160
-
161
-
162
-
163
-
164
-
165
-
166
-
167
-
168
-
169
-
170
-
171
-
172
-
173
-
 174
174 -
 175
175 -
 176
176 -
 177
177 -
 178
178 -
 179
179 -
 180
180 -
 181
181 -
 182
182 -
 183
183 -
 184
184 -
 185
185 -
 186
186 -
 187
187 -
 188
188 -
 189
189 -
 190
190 -
 191
191 -
 192
192 -
 193
193 -
 194
194 -
195
-
196
 |
 |

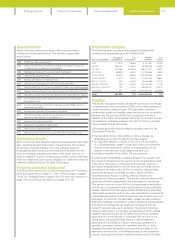
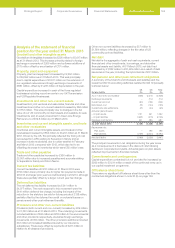
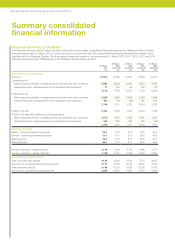
Reconciliation of adjusted operating profit to
adjusted earnings and earnings
Adjusted earnings is presented in note 7 to the consolidated financial
statements on page 107.
Year ended 31 March
2014
£m
2013
(restated)1
£m
2012
(restated)1
£m
Adjusted operating profit 3,664 3,639 3,491
Adjusted net finance costs (1,108) (1,124) (1,090)
Share of post-tax results of joint ventures 28 18 7
Adjusted profit before tax 2,584 2,533 2,408
Adjusted taxation (581) (619) (697)
Adjusted profit after tax 2,003 1,914 1,711
Attributable to non-controlling interests 12 (1) (2)
Adjusted earnings 2,015 1,913 1,709
Exceptional items after tax 388 75 174
Remeasurements after tax 73 156 (122)
Stranded cost recoveries after tax –9156
Earnings 2,476 2,153 1,917
1. See note 1 on page 92.
Reconciliation of adjusted basic EPS toEPS
Adjusted basic EPS is presented in note 7 to the consolidated
financial statements on page 107.
Year ended 31 March
2014
pence
2013
(restated)1
pence
2012
(restated)1
pence
Adjusted EPS 54.0 51.4 46.0
Exceptional items after tax 10.4 2.0 4.7
Remeasurements after tax 2.0 4.2 (3.3)
Stranded cost recoveries after tax –0.2 4.2
Earnings per share 66.4 57. 8 51.6
1. See note 1 on page 92.
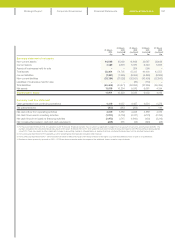
Reconciliation of adjusted operating profit
excludingtiming differences and major storms
tototaloperating profit
Adjusted operating profit excluding timing differences and major
storms is discussed on page 09.
Year ended 31 March
2014
£m
2013
(restated)1
£m
2012
(restated)1
£m
Adjusted operating profit excluding timing
differences and major storms 3,706 3,759 3,589
Major storms –(136) (116)
Adjusted operating profit excluding
timingdifferences 3,706 3,623 3,473
Timing differences (42) 16 18
Adjusted operating profit 3,664 3,639 3,491
Exceptional items, remeasurements
and stranded cost recoveries 71 110 44
Total operating profit 3,735 3,74 9 3,535
1. See note 1 on page 92.
Use of adjusted profit measures
In considering the financial performance of our businesses and
segments, we analyse each of our primary financial measures of
operating profit, profit before tax, profit for the year attributable to
equity shareholders and EPS into two components.
The first of these components is referred to as an adjusted profit
measure, also known as a business performance measure. This
isthe principal measure used by management to assess the
performance of the underlying business.
Adjusted results exclude exceptional items, remeasurements and
stranded cost recoveries. These items are reported collectively
asthe second component of the financial measures. Note 4 on
page 99 explains in detail the items which are excluded from our
adjusted profit measures.
Adjusted profit measures have limitations in their usefulness
compared with the comparable total profit measures as they
exclude important elements of our financial performance.
However, we believe that by presenting our financial performance
in two components it is easier to read and interpret financial
performance between periods, as adjusted profit measures are
more comparable having removed the distorting effect of the
excluded items. Those items are more clearly understood if
separately identified and analysed.
The presentation of these two components of financial performance
is additional to, and not a substitute for, the comparable total profit
measures presented.
Management uses adjusted profit measures as the basis for
monitoring financial performance and in communicating financial
performance to investors in external presentations and
announcements of financial results.
Internal financial reports, budgets and forecasts are primarily
prepared on the basis of adjusted profit measures, although
planned exceptional items, such as significant restructuring, are
also reflected in budgets and forecasts. We separately monitor
and disclose the excluded itemsas a component of our overall
financial performance.
Reconciliation of adjusted operating profit to total
operating profit
Adjusted operating profit is presented on the face of the income
statement under the heading operating profit before exceptional
items, remeasurements and stranded cost recoveries.
Year ended 31 March
2014
£m
2013
(restated)1
£m
2012
(restated)1
£m
Adjusted operating profit 3,664 3,639 3,491
Exceptional items 55 (84) (122)
Remeasurements – commodity contracts 16 180 (94)
Stranded cost recoveries –14 260
Total operating profit 3,735 3,749 3,535
1. See note 1 on page 92.
Other unaudited financial information
Reconciliations of adjusted profit measures
182 National Grid Annual Report and Accounts 2013/14