National Grid 2014 Annual Report Download - page 70
Download and view the complete annual report
Please find page 70 of the 2014 National Grid annual report below. You can navigate through the pages in the report by either clicking on the pages listed below, or by using the keyword search tool below to find specific information within the annual report.-
 1
1 -
2
-
3
-
4
-
5
-
6
-
7
-
8
-
9
-
10
-
11
-
12
-
13
-
14
-
15
-
16
-
17
-
18
-
19
-
20
-
21
-
22
-
23
-
24
-
25
-
26
-
27
-
28
-
29
-
30
-
31
-
32
-
33
-
34
-
35
-
36
-
37
-
38
-
39
-
40
-
41
-
42
-
43
-
44
-
45
-
46
-
47
-
48
-
49
-
50
-
51
-
52
-
53
-
54
-
55
-
56
-
57
-
58
-
59
-
 60
60 -
 61
61 -
 62
62 -
 63
63 -
 64
64 -
 65
65 -
 66
66 -
 67
67 -
 68
68 -
 69
69 -
 70
70 -
 71
71 -
 72
72 -
 73
73 -
 74
74 -
 75
75 -
 76
76 -
 77
77 -
 78
78 -
 79
79 -
 80
80 -
81
-
82
-
83
-
84
-
85
-
86
-
87
-
88
-
89
-
90
-
91
-
92
-
93
-
94
-
95
-
96
-
97
-
98
-
99
-
100
-
101
-
102
-
103
-
104
-
105
-
106
-
107
-
108
-
109
-
110
-
111
-
112
-
113
-
114
-
115
-
116
-
117
-
118
-
119
-
120
-
121
-
122
-
123
-
124
-
125
-
126
-
127
-
128
-
129
-
130
-
131
-
132
-
133
-
134
-
135
-
136
-
137
-
138
-
139
-
140
-
141
-
142
-
143
-
144
-
145
-
146
-
147
-
148
-
149
-
150
-
151
-
152
-
153
-
154
-
155
-
156
-
157
-
158
-
159
-
160
-
161
-
162
-
163
-
164
-
165
-
166
-
167
-
168
-
169
-
170
-
171
-
172
-
173
-
174
-
175
-
176
-
177
-
178
-
179
-
180
-
181
-
182
-
183
-
184
-
185
-
186
-
187
-
188
-
189
-
190
-
191
-
192
-
193
-
194
-
195
-
196
 |
 |

Remuneration
Report
continued
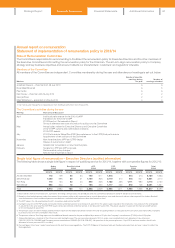
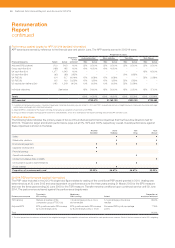
Performance against targets for APP 2013/14 (audited information)
APP awards are earned by reference to the financial year and paid in June. The APP awards earned in 2013/14 were:
Proportion
of max
achieved
Proportion of salary
Financial measures Target Actual
Andrew Bonfield Steve Holliday Tom King Nick Winser
Max Actual Max Actual Max Actual Max Actual
Adjusted EPS (p/share) 51.0 54.3 100% 25% 25.00% 25% 25.00% 25% 25.00% 25% 25.00%
Group cash flow (£m) (188) 195 100% 40% 40.00% 40% 40.00% ––––
UK cash flow (£m) 1,077 1,543 100% ––––––45% 45.00%
US cash flow ($m) (62) (85) 29.5% – – – – 30% 8.85% – –
UK RoE (%) 12.4 12.7 62.46% 15% 9.38% 15% 9.38% – – 35% 21.88%
US RoE (%) 9.2 9.0 23.33% 15% 3.50% 15% 3.50% 25% 5.83% – –
US capital plan delivery (£m) 1,192 1,219 90.3% 10% 9.03% 10% 9.03% 25% 22.58% – –
Individual objectives See below 45% 24.00% 45% 30.00% 45% 21.00% 45% 37. 0 0 %
Totals 150% 110.91% 150% 116.91% 150% 83.26% 150% 128.88%
APP awarded £789,679 £1,169,100 £595,155 £703,685
1. In relation to the financial measures, threshold, target and stretch performance pays out at 6.67%, 40% and 100% respectively and on a straight-line basis in between threshold and target
performance and target and stretchperformance.
2. Adjusted EPS is amended for the impact of timing and actuarial assumptions on pensions and OPEBs.
3. Group cash flow excludes working capital movements and dividends, and is also amended for the impact of timing and certain LIPA transition costs.
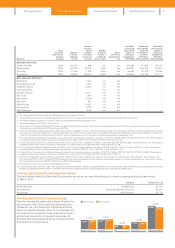
Individual objectives
The following table indicates the primary areas of focus of the individual performance objectives that the Executive Directors had for
2013/14. Threshold, target and stretch performance pays out at 0%, 50% and 100% respectively overall. Overall performance against
these objectives is shown in the table:
Andrew
Bonfield
Steve
Holliday
Tom
King
Nick
Winser
Safety • • •
Stakeholder relations • •
Employee engagement ••••
Capability development •
Financial strategy •
Operational excellence •
UK Electricity Market Reform (EMR) •
US foundation (system implementation) • •
Group strategy •
Proportion of maximum achieved 53.33% 66.67% 46.67% 82.22%
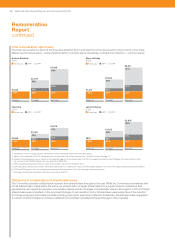
2013/14 PSP performance (audited information)
The PSP value included in the 2013/14 single total figure relates to vesting of the conditional PSP award granted in 2010. Vesting was
determined as at 30 June 2013 and was dependent on performance over the three years ending 31 March 2013 for the EPS measure
and over the three years ending 30 June 2013 for the TSR measure. Transfer remains conditional upon continued service until 30June
2014. The performance achieved against the performance targets was:
Performance measure
Threshold –
25% vesting
Maximum –
100% vesting Actual
Proportion of
maximum achieved
TSR ranking Ranked at median of the
comparator group (FTSE 100)
7.5 percentage points or more
above median
5.7 percentage points above
median
83.3%
Adjusted EPS EPS growth exceeds RPI increase
by 3 percentage points
EPS growth exceeds RPI increase
by 8 percentage points or more
Exceeded RPI by 6.5 percentage
points
77. 9%
Total 80.6%
1. The total proportion of maximum achieved is the weighted average of the proportion of maximum achieved for each performance measure. Each of the two measures had a 50% weighting.
68 National Grid Annual Report and Accounts 2013/14