National Grid 2014 Annual Report Download - page 10
Download and view the complete annual report
Please find page 10 of the 2014 National Grid annual report below. You can navigate through the pages in the report by either clicking on the pages listed below, or by using the keyword search tool below to find specific information within the annual report.-
 1
1 -
 2
2 -
 3
3 -
 4
4 -
 5
5 -
 6
6 -
 7
7 -
 8
8 -
 9
9 -
 10
10 -
 11
11 -
 12
12 -
 13
13 -
 14
14 -
 15
15 -
 16
16 -
 17
17 -
 18
18 -
 19
19 -
 20
20 -
 21
21 -
22
-
23
-
24
-
25
-
26
-
27
-
28
-
29
-
30
-
31
-
32
-
33
-
34
-
35
-
36
-
37
-
38
-
39
-
40
-
41
-
42
-
43
-
44
-
45
-
46
-
47
-
48
-
49
-
50
-
51
-
52
-
53
-
54
-
55
-
56
-
57
-
58
-
59
-
60
-
61
-
62
-
63
-
64
-
65
-
66
-
67
-
68
-
69
-
70
-
71
-
72
-
73
-
74
-
75
-
76
-
77
-
78
-
79
-
80
-
81
-
82
-
83
-
84
-
85
-
86
-
87
-
88
-
89
-
90
-
91
-
92
-
93
-
94
-
95
-
96
-
97
-
98
-
99
-
100
-
101
-
102
-
103
-
104
-
105
-
106
-
107
-
108
-
109
-
110
-
111
-
112
-
113
-
114
-
115
-
116
-
117
-
118
-
119
-
120
-
121
-
122
-
123
-
124
-
125
-
126
-
127
-
128
-
129
-
130
-
131
-
132
-
133
-
134
-
135
-
136
-
137
-
138
-
139
-
140
-
141
-
142
-
143
-
144
-
145
-
146
-
147
-
148
-
149
-
150
-
151
-
152
-
153
-
154
-
155
-
156
-
157
-
158
-
159
-
160
-
161
-
162
-
163
-
164
-
165
-
166
-
167
-
168
-
169
-
170
-
171
-
172
-
173
-
174
-
175
-
176
-
177
-
178
-
179
-
180
-
181
-
182
-
183
-
184
-
185
-
186
-
187
-
188
-
189
-
190
-
191
-
192
-
193
-
194
-
195
-
196
 |
 |
Financial
review
continued
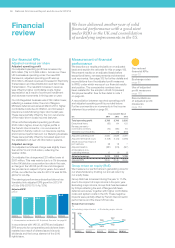
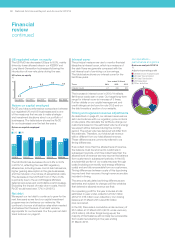
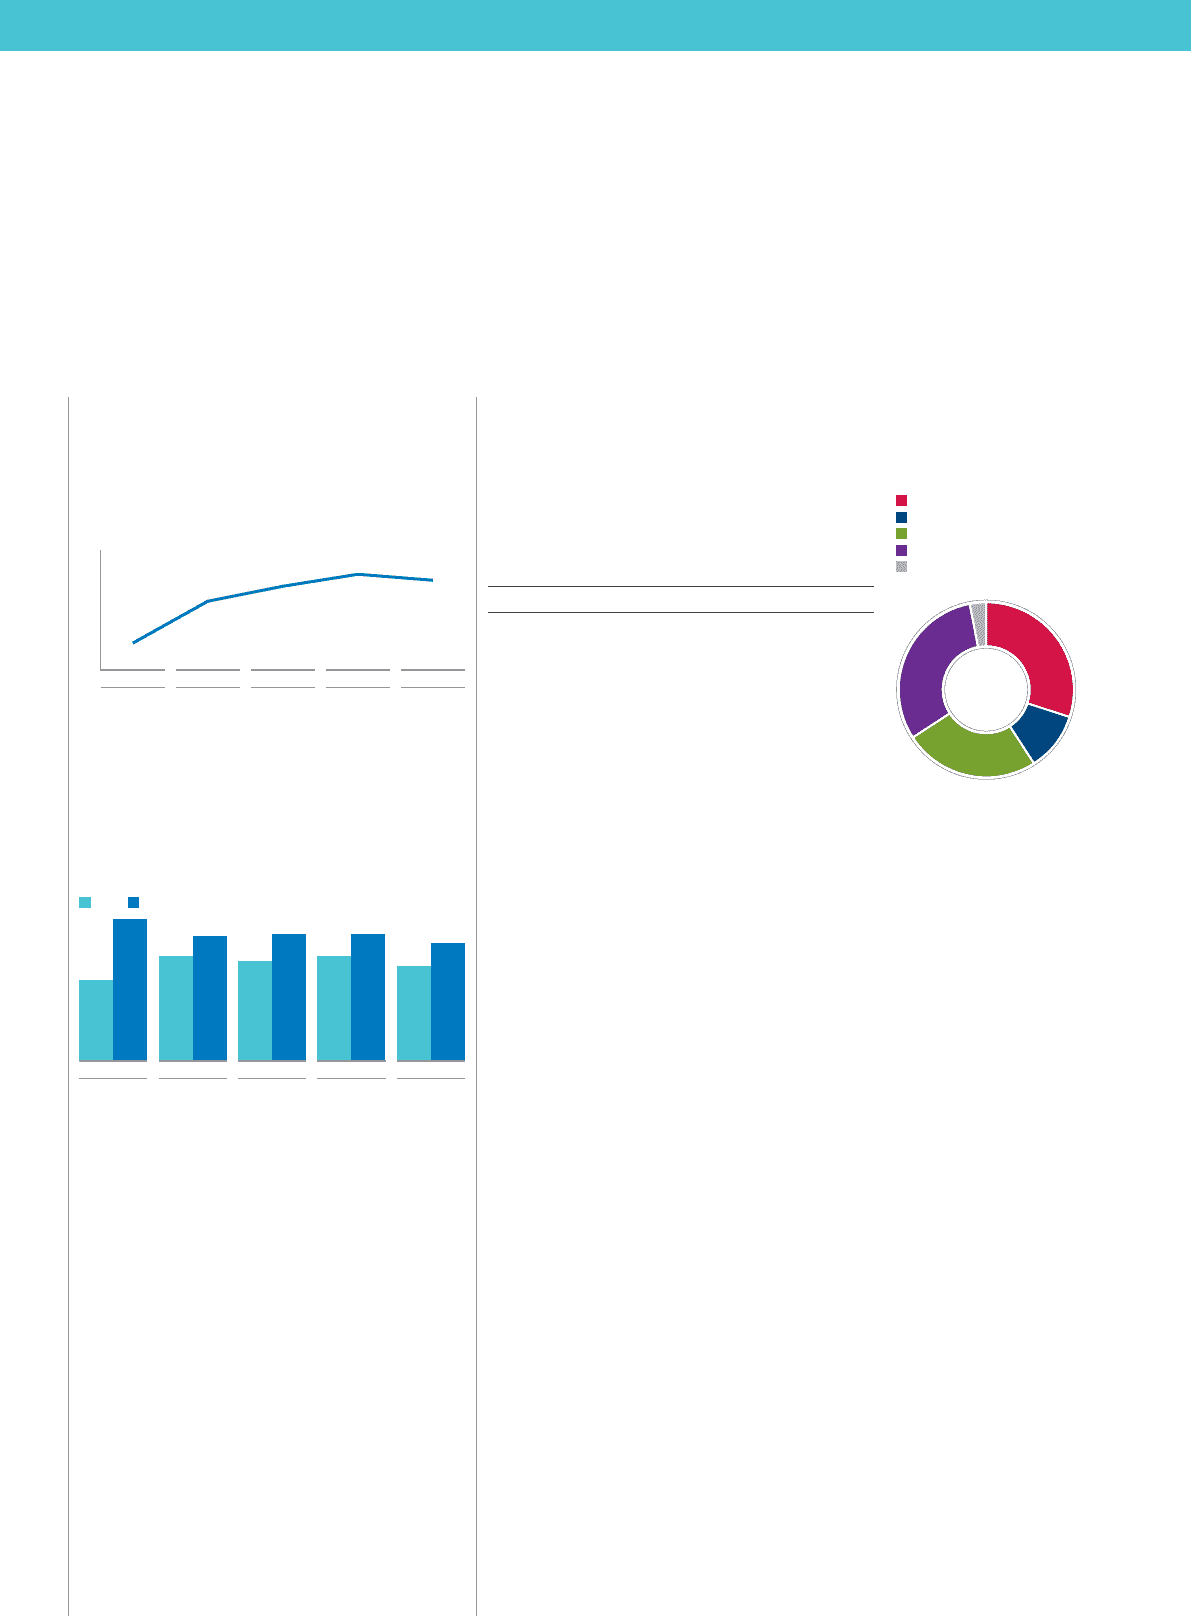
US regulated return on equity
The US RoE has decreased 20bps to 9.0%, mainly
driven by lower allowed rates in our KEDNY and
Long Island Generation businesses following the
introduction of new rate plans during the year.
US return on equity
%
6
8
10
6.9
8.3
8.8 9.2 9.0
Dec 2009 Dec 2010 Dec 2011 Dec 2012 Dec 2013
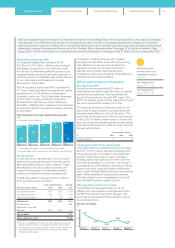
Return on capital employed
RoCE provides a performance comparison between
our regulated UK and US businesses and is one
ofthe measures that we use to make strategic
andinvestment decisions about our portfolio of
businesses. The table below shows the RoCE
forour businesses over the last five years:
Return on capital employed
%
7.1
8.5
6.8
8.6
7.1
8.6
6.4
8.0
5.5
9.6
2009/10 2010/11 2011/12 2012/13 2013/14
US UK
The UK RoCE has decreased from 8.6% to 8.0%
in2013/14, reflecting the new RIIO regulatory
allowances, including lower cost of debt allowance,
higher gearing assumption in the gas businesses,
and the inclusion of our share of exceptional costs.
The decrease in the US RoCE from 7.1% to 6.4%
isprimarily due to the end of Niagara Mohawk
deferral recoveries and controllable cost increases.
Excluding the impact of major storm costs, the US
RoCE would have been 7.7% in 2012/13.
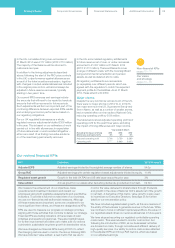
Net debt
We expect our net debt to continue to grow for the
next few years as we fund our capital investment
programmes and enhance our networks. We
continue to borrow at attractive rates when needed
and believe that the level of net debt remains
appropriate for our business. Our five year net debt
trend is shown on page 91.
Interest cover
The principal measure we use to monitor financial
discipline is interest cover, which is a measure of
thecash flows we generate compared with the
netinterest cost of servicing our borrowings.
Thetable below shows our interest cover for the
lastthreeyears.
Year ended 31 March
Times 2014 2013 2012
Interest cover 4.1 3.9 3.9
The increase in interest cover in 2013/14 reflects
flatfinance costs year on year. Our target long-term
range for interest cover is in excess of 3 times.
Further details on our capital management and
credit ratings can be found in note 30 (f) and on
thedebt investors’ section of our website.
Timing and regulated revenue adjustments
As described on page 20, our allowed revenues are
set in accordance with our regulatory price controls
or rate plans. We calculate the tariffs we charge our
customers based on the estimated volume of energy
we expect will be delivered during the coming
period. The actual volumes delivered will differ from
this estimate. Therefore, our total actual revenue
willbe different from our total allowed revenue.
These differences are commonly referred to as
timing differences.
If we collect more than the allowed level of revenue,
the balance must be returned to customers in
subsequent periods, and if we collect less than the
allowed level of revenue we may recover the balance
from customers in subsequent periods. In the US,
asubstantial portion of our costs are pass-through
costs (including commodity and energy efficiency
costs) and are fully recoverable from our customers.
Timing differences between costs of this type being
incurred and their recovery through revenue are also
included in timing.
The amounts calculated as timing differences are
estimates and subject to change until the variables
that determine allowed revenue are final.
Our operating profit for the year includes a total
estimated in-year under-collection of £42 million
(2012/13: £16 million over-collection). Our closing
balance at 31March 2014 was £60 million
over-recovered.
In the UK, there was a cumulative under-recovery of
£57 million at 31 March 2014 (2013: under-recovery
of £5 million). All other things being equal, the
majority of that balance will normally be recoverable
from customers starting in the year ending
31 March 2016.
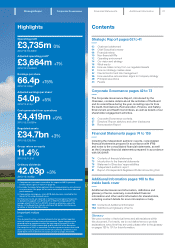
Our operations –
performance at a glance
Business analysis 2013/14
%
30
3
31
25
11
UK Electricity Transmission
UK Gas Transmission
UK Gas Distribution
US Regulated
Other activities
Adjusted operating profit
08 National Grid Annual Report and Accounts 2013/14