National Grid 2014 Annual Report Download - page 188
Download and view the complete annual report
Please find page 188 of the 2014 National Grid annual report below. You can navigate through the pages in the report by either clicking on the pages listed below, or by using the keyword search tool below to find specific information within the annual report.-
 1
1 -
2
-
3
-
4
-
5
-
6
-
7
-
8
-
9
-
10
-
11
-
12
-
13
-
14
-
15
-
16
-
17
-
18
-
19
-
20
-
21
-
22
-
23
-
24
-
25
-
26
-
27
-
28
-
29
-
30
-
31
-
32
-
33
-
34
-
35
-
36
-
37
-
38
-
39
-
40
-
41
-
42
-
43
-
44
-
45
-
46
-
47
-
48
-
49
-
50
-
51
-
52
-
53
-
54
-
55
-
56
-
57
-
58
-
59
-
60
-
61
-
62
-
63
-
64
-
65
-
66
-
67
-
68
-
69
-
70
-
71
-
72
-
73
-
74
-
75
-
76
-
77
-
78
-
79
-
80
-
81
-
82
-
83
-
84
-
85
-
86
-
87
-
88
-
89
-
90
-
91
-
92
-
93
-
94
-
95
-
96
-
97
-
98
-
99
-
100
-
101
-
102
-
103
-
104
-
105
-
106
-
107
-
108
-
109
-
110
-
111
-
112
-
113
-
114
-
115
-
116
-
117
-
118
-
119
-
120
-
121
-
122
-
123
-
124
-
125
-
126
-
127
-
128
-
129
-
130
-
131
-
132
-
133
-
134
-
135
-
136
-
137
-
138
-
139
-
140
-
141
-
142
-
143
-
144
-
145
-
146
-
147
-
148
-
149
-
150
-
151
-
152
-
153
-
154
-
155
-
156
-
157
-
158
-
159
-
160
-
161
-
162
-
163
-
164
-
165
-
166
-
167
-
168
-
169
-
170
-
171
-
172
-
173
-
174
-
175
-
176
-
177
-
 178
178 -
 179
179 -
 180
180 -
 181
181 -
 182
182 -
 183
183 -
 184
184 -
 185
185 -
 186
186 -
 187
187 -
 188
188 -
 189
189 -
 190
190 -
 191
191 -
 192
192 -
 193
193 -
 194
194 -
 195
195 -
 196
196
 |
 |

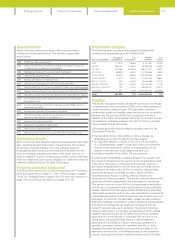
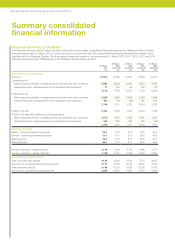
Financial summary (unaudited)
The financial summary set out below has been derived from the audited consolidated financial statements of National Grid for the five
financial years ended 31 March 2014. It should be read in conjunction with the consolidated financial statements and related notes,
together with the Strategic Review. The information presented below for the years ended 31 March 2010, 2011, 2012, 2013 and 2014
hasbeen prepared under IFRS issued by the IASB and as adopted by the EU1.
31 March
2014
£m
31 March
2013
(restated)1
£m
31 March
2012
(restated)1
£m
31 March
2011
(restated)1
£m
31 March
2010
(restated)1
£m
Summary income statement
Revenue 214,809 14,359 13,832 14,343 14,007
Operating profit
Before exceptional items, remeasurements and stranded cost recoveries 3,664 3,639 3,491 3,619 3,134
Exceptional items, remeasurements and stranded cost recoveries 71 110 44 145 172
3,735 3,749 3,535 3,764 3,306
Profit before tax
Before exceptional items, remeasurements and stranded cost recoveries 2,584 2,533 2,408 2,283 1,999
Exceptional items, remeasurements and stranded cost recoveries 164 178 (26) 151 219
2,748 2,711 2,382 2,434 2,218
Profit for the year 2,464 2,154 1,919 2,043 1,418
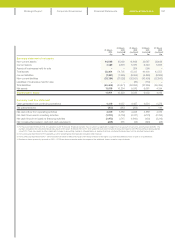
Profit for the year attributable to equity shareholders
Before exceptional items, remeasurements and stranded cost recoveries 2,015 1,913 1,709 1,627 1,447
Exceptional items, remeasurements and stranded cost recoveries 461 240 208 412 (32)
2,476 2,153 1,917 2,039 1,415
Earnings per share
Basic – continuing operations (pence)366.4 57. 8 51.6 56.9 46.1
Diluted – continuing operations (pence)366.1 5 7.5 51.3 56.6 45.9
Basic (pence)366.4 57.8 51.6 56.9 46.1
Diluted (pence)366.1 57. 5 51.3 56.6 45.9
Number of shares – basic (millions)43,729 3,724 3,719 3,585 3,071
Number of shares – diluted (millions)43,748 3,742 3,738 3,604 3,084
Dividends per ordinary share
Paid during the year (pence) 40.85 39.84 37.40 37.74 36.65
Approved or proposed during the year (pence) 42.03 40.85 39.28 36.37 38.49
Paid during the year ($) 0.636 0.633 0.599 0.592 0.579
Approved or proposed during the year ($) 0.696 0.632 0.623 0.571 0.608
Summary consolidated
financial information
186 National Grid Annual Report and Accounts 2013/14