National Grid 2014 Annual Report Download - page 163
Download and view the complete annual report
Please find page 163 of the 2014 National Grid annual report below. You can navigate through the pages in the report by either clicking on the pages listed below, or by using the keyword search tool below to find specific information within the annual report.-
 1
1 -
2
-
3
-
4
-
5
-
6
-
7
-
8
-
9
-
10
-
11
-
12
-
13
-
14
-
15
-
16
-
17
-
18
-
19
-
20
-
21
-
22
-
23
-
24
-
25
-
26
-
27
-
28
-
29
-
30
-
31
-
32
-
33
-
34
-
35
-
36
-
37
-
38
-
39
-
40
-
41
-
42
-
43
-
44
-
45
-
46
-
47
-
48
-
49
-
50
-
51
-
52
-
53
-
54
-
55
-
56
-
57
-
58
-
59
-
60
-
61
-
62
-
63
-
64
-
65
-
66
-
67
-
68
-
69
-
70
-
71
-
72
-
73
-
74
-
75
-
76
-
77
-
78
-
79
-
80
-
81
-
82
-
83
-
84
-
85
-
86
-
87
-
88
-
89
-
90
-
91
-
92
-
93
-
94
-
95
-
96
-
97
-
98
-
99
-
100
-
101
-
102
-
103
-
104
-
105
-
106
-
107
-
108
-
109
-
110
-
111
-
112
-
113
-
114
-
115
-
116
-
117
-
118
-
119
-
120
-
121
-
122
-
123
-
124
-
125
-
126
-
127
-
128
-
129
-
130
-
131
-
132
-
133
-
134
-
135
-
136
-
137
-
138
-
139
-
140
-
141
-
142
-
143
-
144
-
145
-
146
-
147
-
148
-
149
-
150
-
151
-
152
-
 153
153 -
 154
154 -
 155
155 -
 156
156 -
 157
157 -
 158
158 -
 159
159 -
 160
160 -
 161
161 -
 162
162 -
 163
163 -
 164
164 -
 165
165 -
 166
166 -
 167
167 -
 168
168 -
 169
169 -
 170
170 -
 171
171 -
 172
172 -
 173
173 -
174
-
175
-
176
-
177
-
178
-
179
-
180
-
181
-
182
-
183
-
184
-
185
-
186
-
187
-
188
-
189
-
190
-
191
-
192
-
193
-
194
-
195
-
196
 |
 |
Strategic Report Corporate Governance Financial Statements Additional Information
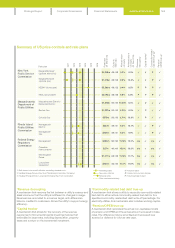
RIIO price controls
Our UK regulator has introduced a new regulatory framework
called RIIO (revenue = incentives + innovation + outputs) that
became effective on 1 April 2013 and lasts for eight years.
Thebuilding blocks of the RIIO price control are broadly similar
tothe historical price controls used in the UK; however there are
some significant differences in the mechanics of the calculations.
How is revenue calculated?
Under RIIO the outputs we deliver are clearly articulated and are
integrally linked to the calculation of our allowed revenue. These
outputs have been determined through an extensive consultation
process which has given stakeholders a greater opportunity to
input to these decisions. The clarity around outputs should lead
togreater transparency of our performance in delivering them.
The six key output categories are:
• Safety: ensuring the provision of a safe energy network.
• Reliability (and availability): promoting networks capable of
delivering long-term reliability, as well as minimising the number
and duration of interruptions experienced over the price control
period, and ensuring adaptation to climate change.
• Environmental impact: encouraging companies to play their
role in achieving broader environmental objectives – specifically
facilitating the reduction of carbon emissions – as well as
minimising their own carbon footprint.
• Customer and stakeholder satisfaction: maintaining high levels
of customer satisfaction and stakeholder engagement, and
improving service levels.
• Customer connections: encouraging networks to connect
customers quickly and efficiently.
• Social obligations (UK GD only): extending the gas network
tocommunities that are fuel poor where it is efficient to do
soand introducing measures to address carbon monoxide
poisoning incidents.
Within each of these output categories are a number of primary
and secondary deliverables, reflecting what our stakeholders want
us to deliver over the coming price control period. The nature and
number of these deliverables varies according to the output
category, with some being linked directly to our allowed revenue,
some linked to legislation, and others having only a reputational
impact. Ofgem, using information submitted by us along with
independent assessments, determines the efficient level of
expected costs necessary to deliver them. Under RIIO this is
known as totex, short for total expenditure, and is similar to the
sum of controllable opex, capex and repex (for UK GD) under the
previous price control.
A number of assumptions are necessary in setting these outputs,
such as certain prices or the volumes of work that will be needed.
As a result, to protect us and our customers from windfall gains
and losses, there are a number of uncertainty mechanisms within
the RIIO framework that can result in adjustments to totex if actual
prices or volumes differ from the assumptions.
Where we under- or over-spend the allowed totex for reasons that
are not covered by uncertainty mechanisms, there is a sharing
factor, ie the under- or over-spend is shared between us and
customers through an adjustment to allowed revenues in a future
year. This sharing factor provides an incentive for us to provide the
outputs efficiently as we are able to keep a portion of the savings,
with the remainder benefiting our customers.
This sharing factor is one of the ways that RIIO has given
innovation more prominence. Innovation includes traditional areas
such as new technologies, as well as the broader challenge of
finding new ways of working to deliver outputs more efficiently.
This broader challenge will have an impact on everyone in
ourbusiness.
Totex is then split between fast and slow money, a new concept
under RIIO, based on a specified percentage. Fast money
represents the amount of totex that we are able to recover
inthecurrent year. Slow money is added to our RAV.
In addition to fast money, in each year we are allowed to collect
adepreciation of and a return on our RAV.
This operates in a similar way to the previous price control,
although there have been changes to the asset lives for electricity
transmission (transition from 20 years to 45 years evenly across
the RIIO period) and the depreciation calculation for UK GD
(changed from 45 years straight line to 45 years sum of digits for
assets added post 2002). We are also allowed to collect additional
revenues related to non-controllable costs and incentives.
The incentive mechanisms can increase or decrease our
allowedrevenue and result from our performance against
variousmeasures related to our outputs. RIIO has introduced
newincentive mechanisms as a way to provide further incentives
toalign our objectives with those of our customers and other
stakeholders. For example, performance against our customer
satisfaction targets can have a positive or negative effect of up
to1% of allowed annual revenues. Incentives will normally affect
our revenues two years after the year of performance.
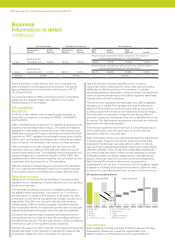
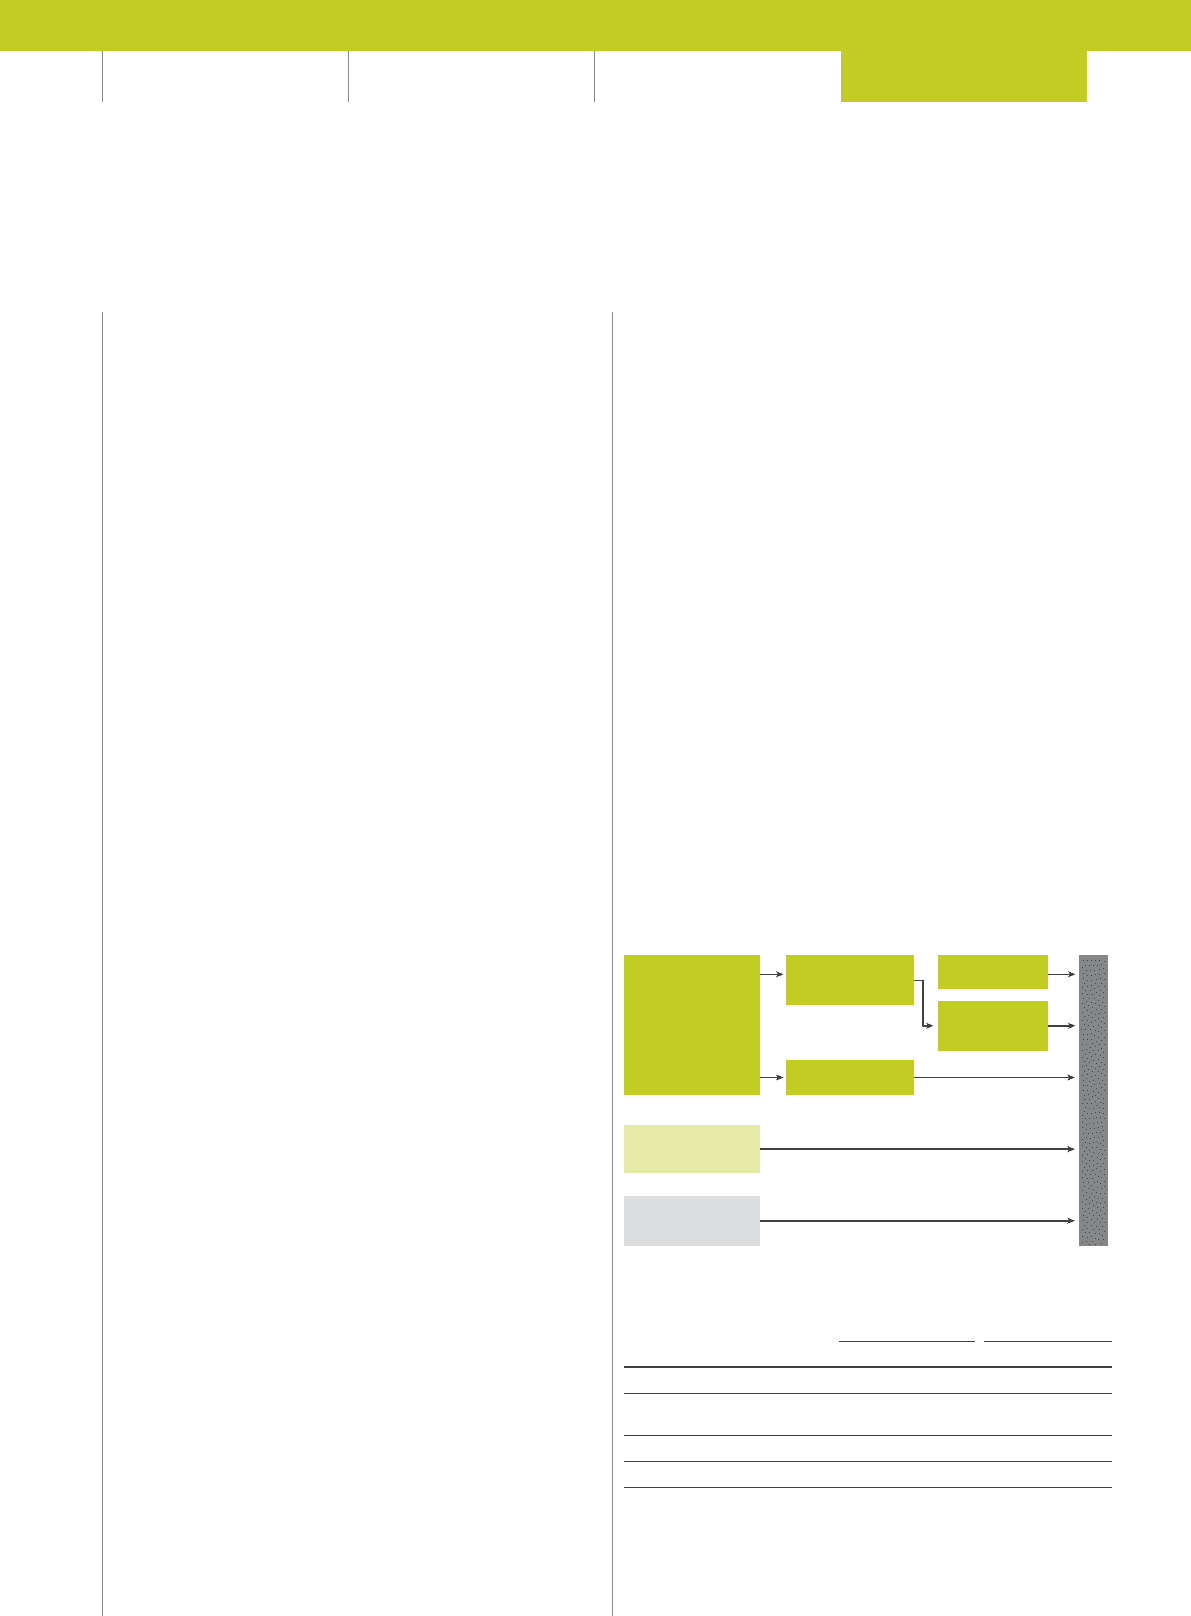
RIIO regulatory building blocks
Revenue
Other costs
eg tax
Performance
against incentives
Totex
(capital invested
+ controllable
operating costs)
Allowed return
Depreciation
of RAV
RAV
(slow money)
Fast money
X
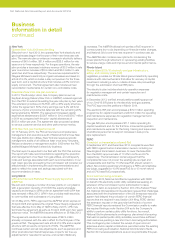
Allowed returns
The cost of capital allowed under RIIO is as follows:
Transmission Gas Distribution
Gas Electricity
Cost of equity (post-tax real) 6.8% 7.0% 6.7%
Cost of debt (pre-tax real) iBoxx 10 year simple trailing average index
(2.92% for 2013/14)
Notional gearing 62.5% 60.0% 65.0%
Vanilla WACC14.38% 4.55% 4.24%
1. Vanilla WACC = cost of debt x gearing + cost of equity x (1- gearing).
161