National Grid 2014 Annual Report Download - page 122
Download and view the complete annual report
Please find page 122 of the 2014 National Grid annual report below. You can navigate through the pages in the report by either clicking on the pages listed below, or by using the keyword search tool below to find specific information within the annual report.-
 1
1 -
2
-
3
-
4
-
5
-
6
-
7
-
8
-
9
-
10
-
11
-
12
-
13
-
14
-
15
-
16
-
17
-
18
-
19
-
20
-
21
-
22
-
23
-
24
-
25
-
26
-
27
-
28
-
29
-
30
-
31
-
32
-
33
-
34
-
35
-
36
-
37
-
38
-
39
-
40
-
41
-
42
-
43
-
44
-
45
-
46
-
47
-
48
-
49
-
50
-
51
-
52
-
53
-
54
-
55
-
56
-
57
-
58
-
59
-
60
-
61
-
62
-
63
-
64
-
65
-
66
-
67
-
68
-
69
-
70
-
71
-
72
-
73
-
74
-
75
-
76
-
77
-
78
-
79
-
80
-
81
-
82
-
83
-
84
-
85
-
86
-
87
-
88
-
89
-
90
-
91
-
92
-
93
-
94
-
95
-
96
-
97
-
98
-
99
-
100
-
101
-
102
-
103
-
104
-
105
-
106
-
107
-
108
-
109
-
110
-
111
-
 112
112 -
 113
113 -
 114
114 -
 115
115 -
 116
116 -
 117
117 -
 118
118 -
 119
119 -
 120
120 -
 121
121 -
 122
122 -
 123
123 -
 124
124 -
 125
125 -
 126
126 -
 127
127 -
 128
128 -
 129
129 -
 130
130 -
 131
131 -
 132
132 -
133
-
134
-
135
-
136
-
137
-
138
-
139
-
140
-
141
-
142
-
143
-
144
-
145
-
146
-
147
-
148
-
149
-
150
-
151
-
152
-
153
-
154
-
155
-
156
-
157
-
158
-
159
-
160
-
161
-
162
-
163
-
164
-
165
-
166
-
167
-
168
-
169
-
170
-
171
-
172
-
173
-
174
-
175
-
176
-
177
-
178
-
179
-
180
-
181
-
182
-
183
-
184
-
185
-
186
-
187
-
188
-
189
-
190
-
191
-
192
-
193
-
194
-
195
-
196
 |
 |

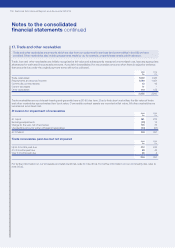
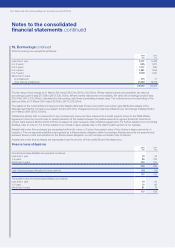
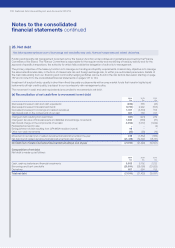
19. Borrowings continued
Total borrowings are repayable as follows:
2014
£m
2013
£m
Less than 1 year 3,511 3,448
In 1-2 years 895 1,872
In 2-3 years 1,177 860
In 3-4 years 1,661 1,255
In 4-5 years 1,509 1,420
More than 5 years:
by instalments 175 71
other than by instalments 17,022 19,169
25,950 28,095
The fair value of borrowings at 31 March 2014 was £28,131m (2013: £30,792m). Where market values were available, fair value of
borrowings (Level 1) was £17,388m (2013: £20,543m). Where market values were not available, fair value of borrowings (Level 2) was
£10,743m (2013: £10,249m), calculated by discounting cash flows at prevailing interest rates. The notional amount outstanding of the
debt portfolio at 31 March 2014 was £25,539m (2013: £27,391m).
The assets of the Colonial Gas Company and the Niagara Mohawk Power Corporation and certain gas distribution assets of the
Narragansett Electric Company are subject to liens and other charges and are provided as collateral over borrowings totalling £438m
at31 March 2014 (2013: £512m).
Collateral is placed with or received from any counterparty where we have entered into a credit support annex to the ISDA Master
Agreement once the current mark-to-market valuation of the trades between the parties exceeds an agreed threshold. Included in
current bank loans is £843m (2013: £730m) in respect of cash received under collateral agreements. For further details of our borrowing
facilities, refer to note 31. For further details of our bonds in issue, please refer to the debt investor section of our website.
Assets held under finance leases are recognised at their fair value or, if lower, the present value of the minimum lease payments on
inception. The corresponding liability is recognised as a finance lease obligation within borrowings. Rental payments are apportioned
between finance costs and reduction in the finance lease obligation, so as to achieve a constant rate of interest.
Assets held under finance leases are depreciated over the shorter of their useful life and the lease term.
Finance lease obligations
2014
£m
2013
£m
Gross finance lease liabilities are repayable as follows:
Less than 1 year 19 20
1-5 years 89 109
More than 5 years 100 101
208 230
Less: finance charges allocated to future periods (38) (35)
170 195
The present value of finance lease liabilities is as follows:
Less than 1 year 19 20
1-5 years 70 96
More than 5 years 81 79
170 195
Notes to the consolidated
financial statements continued
120 National Grid Annual Report and Accounts 2013/14