National Grid 2014 Annual Report Download - page 12
Download and view the complete annual report
Please find page 12 of the 2014 National Grid annual report below. You can navigate through the pages in the report by either clicking on the pages listed below, or by using the keyword search tool below to find specific information within the annual report.-
 1
1 -
 2
2 -
 3
3 -
 4
4 -
 5
5 -
 6
6 -
 7
7 -
 8
8 -
 9
9 -
 10
10 -
 11
11 -
 12
12 -
 13
13 -
 14
14 -
 15
15 -
 16
16 -
 17
17 -
 18
18 -
 19
19 -
 20
20 -
 21
21 -
 22
22 -
23
-
24
-
25
-
26
-
27
-
28
-
29
-
30
-
31
-
32
-
33
-
34
-
35
-
36
-
37
-
38
-
39
-
40
-
41
-
42
-
43
-
44
-
45
-
46
-
47
-
48
-
49
-
50
-
51
-
52
-
53
-
54
-
55
-
56
-
57
-
58
-
59
-
60
-
61
-
62
-
63
-
64
-
65
-
66
-
67
-
68
-
69
-
70
-
71
-
72
-
73
-
74
-
75
-
76
-
77
-
78
-
79
-
80
-
81
-
82
-
83
-
84
-
85
-
86
-
87
-
88
-
89
-
90
-
91
-
92
-
93
-
94
-
95
-
96
-
97
-
98
-
99
-
100
-
101
-
102
-
103
-
104
-
105
-
106
-
107
-
108
-
109
-
110
-
111
-
112
-
113
-
114
-
115
-
116
-
117
-
118
-
119
-
120
-
121
-
122
-
123
-
124
-
125
-
126
-
127
-
128
-
129
-
130
-
131
-
132
-
133
-
134
-
135
-
136
-
137
-
138
-
139
-
140
-
141
-
142
-
143
-
144
-
145
-
146
-
147
-
148
-
149
-
150
-
151
-
152
-
153
-
154
-
155
-
156
-
157
-
158
-
159
-
160
-
161
-
162
-
163
-
164
-
165
-
166
-
167
-
168
-
169
-
170
-
171
-
172
-
173
-
174
-
175
-
176
-
177
-
178
-
179
-
180
-
181
-
182
-
183
-
184
-
185
-
186
-
187
-
188
-
189
-
190
-
191
-
192
-
193
-
194
-
195
-
196
 |
 |

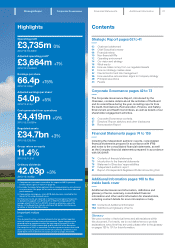
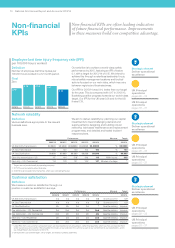
Non-financial
KPIs
Employee lost time injury frequency rate (IFR)
per 100,000 hours worked
Strategic element
Deliver operational
excellence
UK Principal
operations
pages 29 – 33
US Principal
operations
pages 35 – 37
Definition
Number of employee lost time injuries per
100,000hours worked in a 12 month period.
Goal
Zero
2009/10 2010/11 2011/12 2012/13 2013/14
0.15
0.18 0.18 0.17
0.14
Our ambition is to achieve a world-class safety
performance by 2015, featuring an IFR of below
0.1,with a target for 2013/14 of 0.15. We intend to
achieve this through a relentless leadership focus,
robust safety management systems and tactical
actions focused on our main risks, which may vary
between regions and business areas.
Our IFR for 2013/14 was 0.14, better than our target
for the year. This is compared with 0.17 in 2012/13,
illustrating positive progress towards our world-class
target. Our IFR for the UK was 0.06 and for the US
itwas0.19.
Network reliability
Strategic element
Deliver operational
excellence
UK Principal
operations
pages 29 – 33
US Principal
operations
pages 35 – 37
Definition
Various definitions appropriate to the relevant
business area.
We aim to deliver reliability by: planning our capital
investments to meet challenging demand and
supply patterns; designing and building robust
networks; risk-based maintenance and replacement
programmes; and detailed and tested incident
response plans.
Performance Measure Target
2009/10 2010/11 2011/12 2012/13 2013/14 2013/14
UK Electricity Transmission 99.9999 99.9999 99.999999 99.99999 99.99999 %99.9999
UK Gas Transmission 100 100 100 100 100 %100
UK Gas Distribution 99.999 99.999 99.999 99.999 99.999 %99.999
Electricity transmission – US 147 414 5181346 118 MWh losses 308
Electricity – US: Commercial 114 123 121 1052107 Minutes of outage *
* Targets are set jurisdictionally by operating company.
1. 2011/12 result restated to reflect final data.
2. 2012/13 result excludes New Hampshire, which was sold during the year.
Customer satisfaction
Strategic element
Deliver operational
excellence
UK Principal
operations
pages 29 – 33
US Principal
operations
pages 35 – 37
Definition
We measure customer satisfaction through our
position in customer satisfaction surveys.
Performance Measure Target
2009/10 2010/11 2011/12 2012/13 2013/14 2013/14
UK Electricity Transmission n/a n/a n/a n/a 7.4 Score out of 10 6.91
UK Gas Transmission n/a n/a n/a n/a 7. 2 Score out of 10 6.91
UK Gas Distribution 4th 4th 3rd 3rd *Quartile ranking Improve
Gas distribution – US: Residential 3rd 2nd 3rd 3rd 2nd Quartile ranking Improve
Gas distribution – US: Commercial 2nd 4th 3rd 4th 4th Quartile ranking Improve
Electricity – US: Residential 4th 3rd 3rd 3rd 2nd Quartile ranking Improve
Electricity – US: Commercial 3rd 2nd 2nd 3rd 2nd Quartile ranking Improve
* Under RIIO-GD1, our customer satisfaction results are now reported on an annual basis, rather than quarterly, which was how we reported them
under our previous price control. We will publish the results on our website in the summer as part of our commitment to our stakeholders, and in
ourAnnual Report and Accounts for 2014/15.
1. 6.9 represents our baseline target, set by Ofgem, for reward or penalty under RIIO.
Non-nancial KPIs are often leading indicators
offuture nancial performance. Improvements
inthese measures build our competitive advantage.
10 National Grid Annual Report and Accounts 2013/14