National Grid 2014 Annual Report Download - page 114
Download and view the complete annual report
Please find page 114 of the 2014 National Grid annual report below. You can navigate through the pages in the report by either clicking on the pages listed below, or by using the keyword search tool below to find specific information within the annual report.-
 1
1 -
2
-
3
-
4
-
5
-
6
-
7
-
8
-
9
-
10
-
11
-
12
-
13
-
14
-
15
-
16
-
17
-
18
-
19
-
20
-
21
-
22
-
23
-
24
-
25
-
26
-
27
-
28
-
29
-
30
-
31
-
32
-
33
-
34
-
35
-
36
-
37
-
38
-
39
-
40
-
41
-
42
-
43
-
44
-
45
-
46
-
47
-
48
-
49
-
50
-
51
-
52
-
53
-
54
-
55
-
56
-
57
-
58
-
59
-
60
-
61
-
62
-
63
-
64
-
65
-
66
-
67
-
68
-
69
-
70
-
71
-
72
-
73
-
74
-
75
-
76
-
77
-
78
-
79
-
80
-
81
-
82
-
83
-
84
-
85
-
86
-
87
-
88
-
89
-
90
-
91
-
92
-
93
-
94
-
95
-
96
-
97
-
98
-
99
-
100
-
101
-
102
-
103
-
 104
104 -
 105
105 -
 106
106 -
 107
107 -
 108
108 -
 109
109 -
 110
110 -
 111
111 -
 112
112 -
 113
113 -
 114
114 -
 115
115 -
 116
116 -
 117
117 -
 118
118 -
 119
119 -
 120
120 -
 121
121 -
 122
122 -
 123
123 -
 124
124 -
125
-
126
-
127
-
128
-
129
-
130
-
131
-
132
-
133
-
134
-
135
-
136
-
137
-
138
-
139
-
140
-
141
-
142
-
143
-
144
-
145
-
146
-
147
-
148
-
149
-
150
-
151
-
152
-
153
-
154
-
155
-
156
-
157
-
158
-
159
-
160
-
161
-
162
-
163
-
164
-
165
-
166
-
167
-
168
-
169
-
170
-
171
-
172
-
173
-
174
-
175
-
176
-
177
-
178
-
179
-
180
-
181
-
182
-
183
-
184
-
185
-
186
-
187
-
188
-
189
-
190
-
191
-
192
-
193
-
194
-
195
-
196
 |
 |

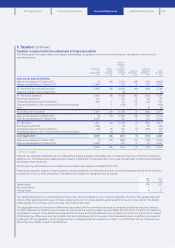
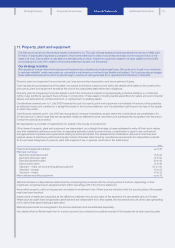
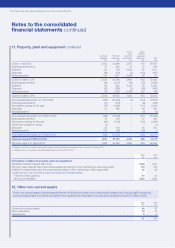
11. Property, plant and equipment continued
Land and
buildings
£m
Plant and
machinery
£m
Assets
in the
course of
construction
£m
Motor
vehicles
and office
equipment
£m
Total
£m
Cost at 1 April 2012 2,013 42,699 2,975 770 48,457
Exchange adjustments 55 803 45 13 916
Additions 141 704 2,584 82 3,511
Disposals (24) (311) (2) (130) (467)
Reclassifications1140 1,471 (1,642) 68 37
Cost at 31 March 2013 2,325 45,366 3,960 803 52,454
Exchange adjustments (99) (1,471) (82) (28) (1,680)
Additions 69 623 2,514 56 3,262
Disposals (32) (288) (2) (98) (420)
Reclassifications1(15) 2,195 (2,366) 120 (66)
Cost at 31 March 2014 2,248 46,425 4,024 853 53,550
Accumulated depreciation at 1 April 2012 (436) (13,804) (2) (514) (14,756)
Exchange adjustments (11) (216) –(9) (236)
Depreciation charge for the year2(75) (1,085) –(121) (1,281)
Disposals 23 299 296 420
Reclassifications1–––(9) (9)
Accumulated depreciation at 31 March 2013 (499) (14,806) –(557) (15,862)
Exchange adjustments 16 399 –21 436
Depreciation charge for the year2(84) (1,112) –(103) (1,299)
Impairment charge for the year (1) – – – (1)
Disposals 25 234 –93 352
Reclassifications1107 (65) –(39) 3
Accumulated depreciation at 31 March 2014 (436) (15,350) –(585) (16,371)
Net book value at 31 March 2014 1,812 31,075 4,024 268 37,179
Net book value at 31 March 2013 1,826 30,560 3,960 246 36,592
1. Represents amounts transferred between categories and from/(to) other intangible assets (see note 10 on page 110).
2. Includes amounts in respect of capitalised depreciation of £10m (2013: £21m).
2014
£m
2013
£m
Information in relation to property, plant and equipment
Capitalised interest included within cost 1,409 1,275
Net book value of assets held under finance leases (all relating to motor vehicles and office equipment) 170 188
Additions to assets held under finance leases (all relating to motor vehicles and office equipment) 25 48
Contributions to cost of property, plant and equipment included within:
Trade and other payables 44 43
Non-current liabilities 1,526 1,492
12. Other non-current assets
Other non-current assets includes assets that do not fall into any other non-current asset category (such as goodwill or property,
plant and equipment) and where the benefit to be received from the asset is not due to be received until after 31 March 2015.
2014
£m
2013
£m
Commodity contract assets 45 47
Other receivables 33 51
Prepayments 96
87 104
Notes to the consolidated
financial statements continued
112 National Grid Annual Report and Accounts 2013/14