National Grid 2014 Annual Report Download - page 127
Download and view the complete annual report
Please find page 127 of the 2014 National Grid annual report below. You can navigate through the pages in the report by either clicking on the pages listed below, or by using the keyword search tool below to find specific information within the annual report.-
 1
1 -
2
-
3
-
4
-
5
-
6
-
7
-
8
-
9
-
10
-
11
-
12
-
13
-
14
-
15
-
16
-
17
-
18
-
19
-
20
-
21
-
22
-
23
-
24
-
25
-
26
-
27
-
28
-
29
-
30
-
31
-
32
-
33
-
34
-
35
-
36
-
37
-
38
-
39
-
40
-
41
-
42
-
43
-
44
-
45
-
46
-
47
-
48
-
49
-
50
-
51
-
52
-
53
-
54
-
55
-
56
-
57
-
58
-
59
-
60
-
61
-
62
-
63
-
64
-
65
-
66
-
67
-
68
-
69
-
70
-
71
-
72
-
73
-
74
-
75
-
76
-
77
-
78
-
79
-
80
-
81
-
82
-
83
-
84
-
85
-
86
-
87
-
88
-
89
-
90
-
91
-
92
-
93
-
94
-
95
-
96
-
97
-
98
-
99
-
100
-
101
-
102
-
103
-
104
-
105
-
106
-
107
-
108
-
109
-
110
-
111
-
112
-
113
-
114
-
115
-
116
-
 117
117 -
 118
118 -
 119
119 -
 120
120 -
 121
121 -
 122
122 -
 123
123 -
 124
124 -
 125
125 -
 126
126 -
 127
127 -
 128
128 -
 129
129 -
 130
130 -
 131
131 -
 132
132 -
 133
133 -
 134
134 -
 135
135 -
 136
136 -
 137
137 -
138
-
139
-
140
-
141
-
142
-
143
-
144
-
145
-
146
-
147
-
148
-
149
-
150
-
151
-
152
-
153
-
154
-
155
-
156
-
157
-
158
-
159
-
160
-
161
-
162
-
163
-
164
-
165
-
166
-
167
-
168
-
169
-
170
-
171
-
172
-
173
-
174
-
175
-
176
-
177
-
178
-
179
-
180
-
181
-
182
-
183
-
184
-
185
-
186
-
187
-
188
-
189
-
190
-
191
-
192
-
193
-
194
-
195
-
196
 |
 |

Strategic Report Corporate Governance Financial Statements Additional Information
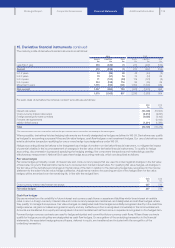
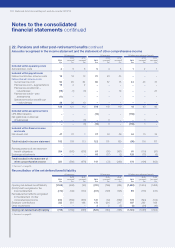
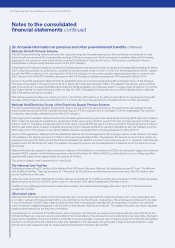
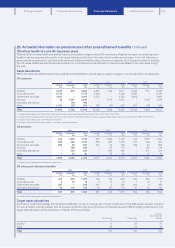
22. Pensions and other post-retirement benefits continued
UK pensions US pensions US other post-retirement benefits
2014
£m
2013
(restated)1
£m
2012
(restated)1
£m
2014
£m
2013
(restated)1
£m
2012
(restated)1
£m
2014
£m
2013
(restated)1
£m
2012
(restated)1
£m
Changes in the present value
ofdefined benefitobligations
(including unfunded obligations)
Opening defined benefit obligations (18,561) (16,775) (15,443) (5,115) (4,611) (4,037) (3,020) (2,630) (2,458)
Current service cost (96) (90) (84) (85) (87) (75) (44) (43) (37)
Interest cost (780) (788) (830) (221) (232) (233) (123) (133) (140)
Actuarial gains/(losses) – experience 16 74 (112) (22) 1(13) 47 60 71
Actuarial losses – demographic
assumptions –– – (129) 5(64) (154) (18) (84)
Actuarial gains/(losses) – financial
assumptions 436 (1,765) (1,062) 57 (245) (422) 49 (218) (70)
Past service credit/(cost) –
redundancies 19 7 6 16 36 (19) 119 5(23)
Special termination benefit cost –
redundancies (39) (20) (13) –– – –– –
Past service cost – augmentations (15) (2) (2) –– – –– –
Past service credit – plan amendments 11 – – –– – 19 – –
Transfers in –– 1 –– – –– –
Medicare subsidy received –– – –– – (17) (19) (6)
Liabilities extinguished on settlements –– – –– – 60 – –
Employee contributions (2) (3) (3) –– – –– –
Benefits paid 849 801 767 291 269 268 117 123 127
Transferred to liabilities of businesses
held for sale –– – –– 3 –– 2
Exchange adjustments –– – 456 (251) (19) 267 (147) (12)
Closing defined benefit obligations (18,162) (18,561) (16,775) (4,752) (5,115) (4,611) (2,680) (3,020) (2,630)
Changes in the fair value of plan
assets
Opening fair value of plan assets 17,392 16,107 15,353 4,378 3,850 3,550 1,515 1,192 1,066
Interest income 733 757 829 194 198 207 69 63 64
Return on assets (less)/greater
thanassumed (98) 1,131 498 175 204 132 108 57 (14)
Administration costs (6) (6) (6) (5) (4) (5) (1) (2) (1)
Transfers out ––(1) –– – –– –
Employer contributions 235 201 198 174 224 217 187 262 198
Employee contributions 23 3 –– – –– –
Benefits paid (849) (801) (767) (291) (269) (268) (117) (123) (127)
Assets distributed in settlements
andtransfers –– – –(39) ––(6) –
Exchange adjustments –– – (396) 214 17 (141) 72 6
Closing fair value of plan assets 17,409 17, 3 9 2 16,107 4,229 4,378 3,850 1,620 1,515 1,192
Actual return on plan assets 635 1,888 1,327 369 402 339 177 120 50
Expected contributions to plans
inthefollowing year 182 181 129 118 183 224 109 196 248
1. See note 1 on page 92.
125