National Grid 2014 Annual Report Download - page 144
Download and view the complete annual report
Please find page 144 of the 2014 National Grid annual report below. You can navigate through the pages in the report by either clicking on the pages listed below, or by using the keyword search tool below to find specific information within the annual report.-
 1
1 -
2
-
3
-
4
-
5
-
6
-
7
-
8
-
9
-
10
-
11
-
12
-
13
-
14
-
15
-
16
-
17
-
18
-
19
-
20
-
21
-
22
-
23
-
24
-
25
-
26
-
27
-
28
-
29
-
30
-
31
-
32
-
33
-
34
-
35
-
36
-
37
-
38
-
39
-
40
-
41
-
42
-
43
-
44
-
45
-
46
-
47
-
48
-
49
-
50
-
51
-
52
-
53
-
54
-
55
-
56
-
57
-
58
-
59
-
60
-
61
-
62
-
63
-
64
-
65
-
66
-
67
-
68
-
69
-
70
-
71
-
72
-
73
-
74
-
75
-
76
-
77
-
78
-
79
-
80
-
81
-
82
-
83
-
84
-
85
-
86
-
87
-
88
-
89
-
90
-
91
-
92
-
93
-
94
-
95
-
96
-
97
-
98
-
99
-
100
-
101
-
102
-
103
-
104
-
105
-
106
-
107
-
108
-
109
-
110
-
111
-
112
-
113
-
114
-
115
-
116
-
117
-
118
-
119
-
120
-
121
-
122
-
123
-
124
-
125
-
126
-
127
-
128
-
129
-
130
-
131
-
132
-
133
-
 134
134 -
 135
135 -
 136
136 -
 137
137 -
 138
138 -
 139
139 -
 140
140 -
 141
141 -
 142
142 -
 143
143 -
 144
144 -
 145
145 -
 146
146 -
 147
147 -
 148
148 -
 149
149 -
 150
150 -
 151
151 -
 152
152 -
 153
153 -
 154
154 -
155
-
156
-
157
-
158
-
159
-
160
-
161
-
162
-
163
-
164
-
165
-
166
-
167
-
168
-
169
-
170
-
171
-
172
-
173
-
174
-
175
-
176
-
177
-
178
-
179
-
180
-
181
-
182
-
183
-
184
-
185
-
186
-
187
-
188
-
189
-
190
-
191
-
192
-
193
-
194
-
195
-
196
 |
 |

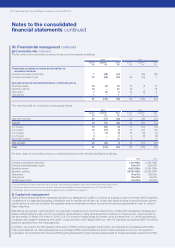
30. Financial risk management continued
(e) Commodity risk continued
The fair value of our commodity contracts by type can be analysed as follows:
2014 2013
Assets
£m
Liabilities
£m
Total
£m
Assets
£m
Liabilities
£m
Total
£m
Commodity purchase contracts accounted for as
derivativecontracts
Forward purchases of electricity 1(49) (48) –(89) (89)
Forward purchases of gas 30 (66) (36) 46 (45) 1
Derivative financial instruments linked to commodity prices
Electricity swaps 26 (6) 20 16 (1) 15
Electricity options 22 –22 16 –16
Gas swaps 7(2) 510 (4) 6
Gas options 1 – 1 1 – 1
87 (123) (36) 89 (139) (50)
The maturity profile of commodity contracts is as follows:
2014 2013
Assets
£m
Liabilities
£m
Total
£m
Assets
£m
Liabilities
£m
Total
£m
Less than one year 42 (77) (35) 42 (69) (27)
Current 42 (77) (35) 42 (69) (27)
In 1-2 years 13 (22) (9) 13 (23) (10)
In 2-3 years 15 (17) (2) 10 (23) (13)
In 3-4 years 4(7) (3) 14 (16) (2)
In 4-5 years 3 – 3 2(8) (6)
More than 5 years 10 –10 8 – 8
Non-current 45 (46) (1) 47 (70) (23)
Total 87 (123) (36) 89 (139) (50)
For each class of commodity contract, our exposure based on the notional quantities is as follows:
2014 2013
Forward purchases of electricity11,740 GWh 2,595 GWh
Forward purchases/sales of gas284m Dth 59m Dth
Electricity swaps 6,603 GWh 6,309 GWh
Electricity options 28,760 GWh 32,999 GWh
Gas swaps 50m Dth 66m Dth
Gas options 23m Dth 4m Dth
NYMEX gas futures320m Dth 17m D th
1. Forward electricity purchases have terms up to four years. The contractual obligations under these contracts are £106m (2013: £174m).
2. Forward gas purchases have terms up to five years. The contractual obligations under these contracts are £171m (2013: £119m).
3. NYMEX gas futures have been offset with related margin accounts (see note 30 (a) on page 137).
(f) Capital risk management
National Grid’s objectives when managing capital are: to safeguard our ability to continue as a going concern; to remain within regulatory
constraints of our regulated operating companies; and to maintain an efficient mix of debt and equity funding thus achieving an optimal
capital structure and cost of capital. We regularly review and maintain or adjust the capital structure as appropriate in order to achieve
these objectives.
Maintaining appropriate credit ratings for our regulated companies is an important aspect of our capital risk management strategy and
balance sheet efficiency. We monitor our balance sheet efficiency using several metrics including our interest cover. Interest cover for
theyear ended 31 March 2014 was 4.1 (2013: 3.9). Our long-term target range for interest cover is greater than 3.0, which we believe is
consistent with single A range long-term senior unsecured debt credit ratings within our main UK operating companies, NGET and NGG,
based on guidance from the rating agencies.
In addition, we monitor the RAV gearing within each of NGET and the regulated transmission and distribution businesses within NGG.
This is calculated as net debt expressed as a percentage of RAV, and indicates the level of debt employed to fund our UK regulated
businesses. It is compared with the level of RAV gearing indicated by Ofgem as being appropriate for these businesses, at around 60-65%.
Notes to the consolidated
financial statements continued
142 National Grid Annual Report and Accounts 2013/14