National Grid 2014 Annual Report Download - page 119
Download and view the complete annual report
Please find page 119 of the 2014 National Grid annual report below. You can navigate through the pages in the report by either clicking on the pages listed below, or by using the keyword search tool below to find specific information within the annual report.-
 1
1 -
2
-
3
-
4
-
5
-
6
-
7
-
8
-
9
-
10
-
11
-
12
-
13
-
14
-
15
-
16
-
17
-
18
-
19
-
20
-
21
-
22
-
23
-
24
-
25
-
26
-
27
-
28
-
29
-
30
-
31
-
32
-
33
-
34
-
35
-
36
-
37
-
38
-
39
-
40
-
41
-
42
-
43
-
44
-
45
-
46
-
47
-
48
-
49
-
50
-
51
-
52
-
53
-
54
-
55
-
56
-
57
-
58
-
59
-
60
-
61
-
62
-
63
-
64
-
65
-
66
-
67
-
68
-
69
-
70
-
71
-
72
-
73
-
74
-
75
-
76
-
77
-
78
-
79
-
80
-
81
-
82
-
83
-
84
-
85
-
86
-
87
-
88
-
89
-
90
-
91
-
92
-
93
-
94
-
95
-
96
-
97
-
98
-
99
-
100
-
101
-
102
-
103
-
104
-
105
-
106
-
107
-
108
-
 109
109 -
 110
110 -
 111
111 -
 112
112 -
 113
113 -
 114
114 -
 115
115 -
 116
116 -
 117
117 -
 118
118 -
 119
119 -
 120
120 -
 121
121 -
 122
122 -
 123
123 -
 124
124 -
 125
125 -
 126
126 -
 127
127 -
 128
128 -
 129
129 -
130
-
131
-
132
-
133
-
134
-
135
-
136
-
137
-
138
-
139
-
140
-
141
-
142
-
143
-
144
-
145
-
146
-
147
-
148
-
149
-
150
-
151
-
152
-
153
-
154
-
155
-
156
-
157
-
158
-
159
-
160
-
161
-
162
-
163
-
164
-
165
-
166
-
167
-
168
-
169
-
170
-
171
-
172
-
173
-
174
-
175
-
176
-
177
-
178
-
179
-
180
-
181
-
182
-
183
-
184
-
185
-
186
-
187
-
188
-
189
-
190
-
191
-
192
-
193
-
194
-
195
-
196
 |
 |

Strategic Report Corporate Governance Financial Statements Additional Information
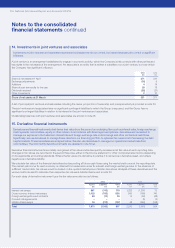
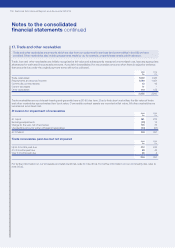
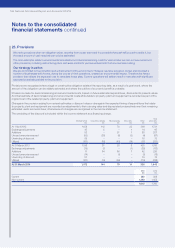
16. Inventories and current intangible assets
Inventories represent assets that we intend to use in order to generate revenue in the short term, either by selling the asset itself
(forexample fuel stocks) or by using it to fulfil a service to a customer or to maintain our network (consumables).
Inventories are stated at the lower of weighted average cost and net realisable value.
Where applicable, cost comprises direct materials and direct labour costs as well as those overheads that have been incurred in bringing
the inventories to their present location and condition.
Emission allowances, principally relating to the emissions of carbon dioxide in the UK and sulphur and nitrous oxides in the US, are
recorded as intangible assets within current assets and are initially recorded at cost and subsequently at the lower of cost and net realisable
value. Where emission allowances are granted by relevant authorities, cost is deemed to be equal to the fair value at the date of allocation.
Receipts of such grants are treated as deferred income, which is recognised in the income statement as the related charges for emissions
are recognised or on impairment of the related intangible asset. A provision is recorded in respect of the obligation to deliver emission
allowances and emission charges are recognised in the income statement in the period in which emissions are made.
2014
£m
2013
£m
Fuel stocks 74 114
Raw materials and consumables 128 156
Work in progress 13 13
Current intangible assets – emission allowances 53 8
268 291
There is a provision for obsolescence of £29m against inventories as at 31 March 2014 (2013: £27m).
117