MoneyGram 2013 Annual Report Download - page 99
Download and view the complete annual report
Please find page 99 of the 2013 MoneyGram annual report below. You can navigate through the pages in the report by either clicking on the pages listed below, or by using the keyword search tool below to find specific information within the annual report.
Table of Contents
The following table is a summary of the Company’s weighted-
average asset allocation for the Pension Plan by asset category at the measurement
date for the years ended December 31 :
The Company records its pension assets at fair value as described in Note 4 — Fair Value Measurement.
The following is a description of the
Pension Plan’s investments at fair value and valuation methodologies:
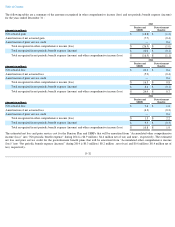
The following tables are a summary of the Pension Plan’s financial assets recorded at fair value, by hierarchy level, as of December 31 :
The Company’s pension plan assets include one
security that the Company considers to be a Level 3 asset for valuation purposes. This security
is an investment in a real estate joint venture and requires the use of unobservable inputs in its fair value measurement. The fair value of this
asset as of December 31, 2013 and 2012 was $4.8 million
. The change in reported net asset value for this asset resulted in a nominal unrealized
gain for 2013 and 2012 .
F-30
2013
2012
Equity securities
45.0
%
56.9
%
Fixed income securities
50.8
%
38.4
%
Real estate
3.5
%
4.0
%
Other
0.7
%
0.7
%
Total
100.0
%
100.0
%
• Short-term investment funds —
These securities are valued at historical cost, which approximates fair value.
• Common collective trusts issued and held by the trustee —
The fair values of the underlying funds in the common/collective trusts
are valued based on the net asset value established for each fund at each valuation date. The net asset value of a collective
investment fund is calculated by dividing the fund's net asset value on the calculation date by the number of units of the fund that
are outstanding on the calculation date, which is derived from observable purchase and redemption activity in the collective
investment fund.
•
Mutual Funds
—
The fair value of the mutual fund issued by registered investment companies is determined using quoted market
prices on the day of valuation.
•
Real estate
—
The Pension Plan trust holds an investment in a real estate development project. The fair value of this investment
represents the estimated fair value of the plan’
s related ownership percentage in the project based upon an appraisal of the
underlying real property as of each balance sheet date. The fund investment strategy for this asset is long-term capital appreciation.
2013
(Amounts in millions) Level 1
Level 2
Level 3
Total
Short-term investment fund
$
—
$
0.9
$
—
$
0.9
Common collective trust — equity securities
Large Cap securities
—
32.8
—
32.8
Small Cap securities
—
8.5
—
8.5
International securities
—
16.8
—
16.8
Emerging markets
—
3.4
—
3.4
Common collective trust — fixed income securities
Core fixed income
—
69.4
—
69.4
Real estate
—
—
4.8
4.8
Total financial assets
$
—
$
131.8
$
4.8
$
136.6
2012
(Amounts in millions) Level 1
Level 2
Level 3
Total
Short-term investment fund
$
—
$
0.9
$
—
$
0.9
Common collective trust — equity securities
Large Cap securities
—
46.1
—
46.1
Small Cap securities
—
11.7
—
11.7
International securities
—
11.2
—
11.2
Common collective trust — fixed income securities
Core fixed income
—
46.7
—
46.7
Real estate
—
—
4.8
4.8
Total financial assets
$
—
$
116.6
$
4.8
$
121.4


