MoneyGram 2013 Annual Report Download - page 123
Download and view the complete annual report
Please find page 123 of the 2013 MoneyGram annual report below. You can navigate through the pages in the report by either clicking on the pages listed below, or by using the keyword search tool below to find specific information within the annual report.-
 1
1 -
2
-
3
-
4
-
5
-
6
-
7
-
8
-
9
-
10
-
11
-
12
-
13
-
14
-
15
-
16
-
17
-
18
-
19
-
20
-
21
-
22
-
23
-
24
-
25
-
26
-
27
-
28
-
29
-
30
-
31
-
32
-
33
-
34
-
35
-
36
-
37
-
38
-
39
-
40
-
41
-
42
-
43
-
44
-
45
-
46
-
47
-
48
-
49
-
50
-
51
-
52
-
53
-
54
-
55
-
56
-
57
-
58
-
59
-
60
-
61
-
62
-
63
-
64
-
65
-
66
-
67
-
68
-
69
-
70
-
71
-
72
-
73
-
74
-
75
-
76
-
77
-
78
-
79
-
80
-
81
-
82
-
83
-
84
-
85
-
86
-
87
-
88
-
89
-
90
-
91
-
92
-
93
-
94
-
95
-
96
-
97
-
98
-
99
-
100
-
101
-
102
-
103
-
104
-
105
-
106
-
107
-
108
-
109
-
110
-
111
-
112
-
 113
113 -
 114
114 -
 115
115 -
 116
116 -
 117
117 -
 118
118 -
 119
119 -
 120
120 -
 121
121 -
 122
122 -
 123
123 -
 124
124 -
 125
125 -
 126
126 -
 127
127 -
 128
128 -
 129
129 -
 130
130 -
 131
131 -
 132
132 -
 133
133 -
134
-
135
-
136
-
137
-
138
 |
 |

Table of Contents
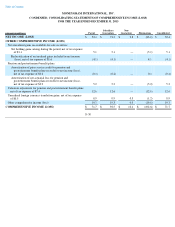
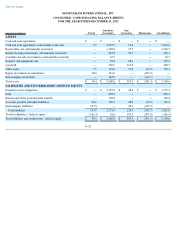
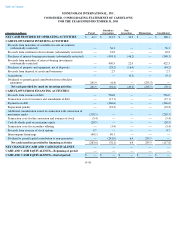
MONEYGRAM INTERNATIONAL, INC.
CONDENSED, CONSOLIDATING BALANCE SHEETS
FOR THE YEAR ENDED DECEMBER 31, 2012
F-52
(Amounts in millions) Parent
Subsidiary
Guarantors
Non-
Guarantors
Eliminations
Consolidated
ASSETS
Cash and cash equivalents
$
—
$
—
$
—
$
—
$
—
Cash and cash equivalents (substantially restricted)
2.3
2,585.5
95.4
—
2,683.2
Receivables, net (substantially restricted)
—
1,190.8
15.7
—
1,206.5
Interest-bearing investments (substantially restricted)
—
425.0
25.1
—
450.1
Available-for-sale investments (substantially restricted)
—
63.5
—
—
63.5
Property and equipment, net
—
99.8
28.1
—
127.9
Goodwill
—
306.9
121.8
—
428.7
Other assets
7.5
181.6
19.4
(17.8
)
190.7
Equity investments in subsidiaries
26.6
181.0
—
(
207.6
)
—
Intercompany receivables
—
165.9
—
(
165.9
)
—
Total assets
$
36.4
$
5,200.0
$
305.5
$
(391.3
)
$
5,150.6
LIABILITIES AND STOCKHOLDERS’ (DEFICIT) EQUITY
Payment service obligations
$
—
$
4,127.0
$
48.4
$
—
$
4,175.4
Debt
—
809.9
—
—
809.9
Pension and other postretirement benefits
—
126.8
—
—
126.8
Accounts payable and other liabilities
60.0
109.7
48.0
(17.8
)
199.9
Intercompany liabilities
137.8
—
28.1
(165.9
)
—
Total liabilities
197.8
5,173.4
124.5
(183.7
)
5,312.0
Total stockholders’ (deficit) equity
(161.4
)
26.6
181.0
(207.6
)
(161.4
)
Total liabilities and stockholders’ (deficit) equity
$
36.4
$
5,200.0
$
305.5
$
(391.3
)
$
5,150.6